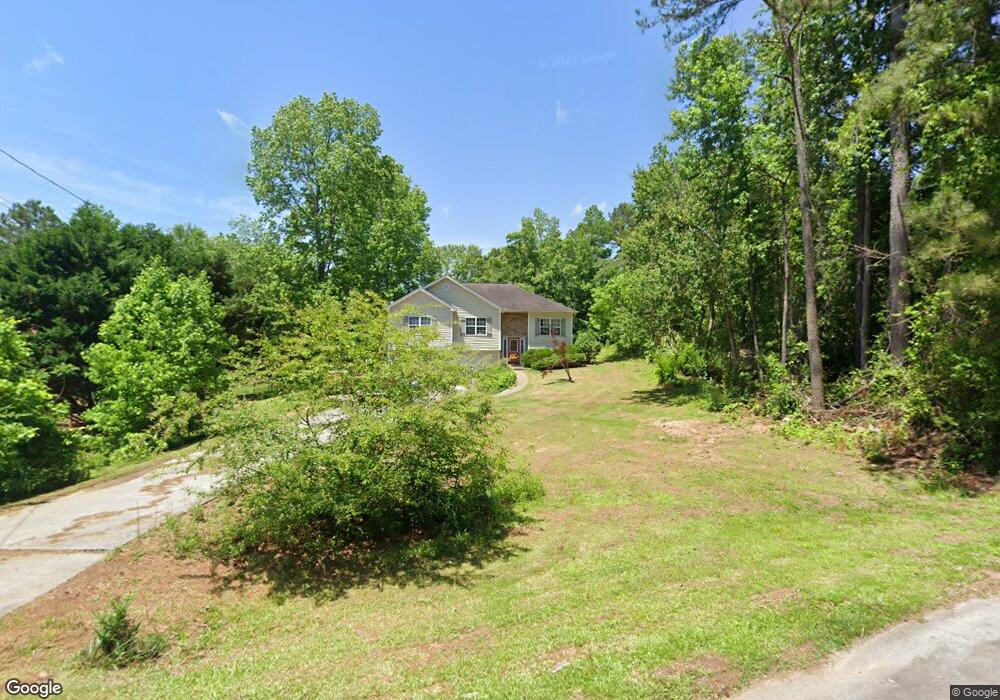
32 Westwood Ct Carrollton, GA 30117
Estimated Value: $243,000 - $304,000
3
Beds
2
Baths
2,379
Sq Ft
$117/Sq Ft
Est. Value
About This Home
This home is located at 32 Westwood Ct, Carrollton, GA 30117 and is currently estimated at $278,748, approximately $117 per square foot. 32 Westwood Ct is a home located in Carroll County with nearby schools including Mt. Zion Elementary School, Mt. Zion Middle School, and Mt. Zion High School.
Ownership History
Date
Name
Owned For
Owner Type
Purchase Details
Closed on
Jun 13, 2018
Sold by
Teal Adam Mark
Bought by
Brown Brandy and Hollis Matthew
Current Estimated Value
Home Financials for this Owner
Home Financials are based on the most recent Mortgage that was taken out on this home.
Original Mortgage
$150,228
Outstanding Balance
$132,528
Interest Rate
5.62%
Mortgage Type
FHA
Estimated Equity
$146,220
Purchase Details
Closed on
Nov 17, 2006
Sold by
Not Provided
Bought by
Teal Adam Mark
Purchase Details
Closed on
Jan 3, 2006
Sold by
Terry Joey W
Bought by
Wells Fargo Bank
Purchase Details
Closed on
Oct 25, 2001
Sold by
Terry Joey W
Bought by
Terry Joey W and Terry Cindy
Purchase Details
Closed on
Oct 20, 1999
Sold by
Southwood Corp
Bought by
Sheffield Leah S
Create a Home Valuation Report for This Property
The Home Valuation Report is an in-depth analysis detailing your home's value as well as a comparison with similar homes in the area
Home Values in the Area
Average Home Value in this Area
Purchase History
| Date | Buyer | Sale Price | Title Company |
|---|---|---|---|
| Brown Brandy | $153,000 | -- | |
| Teal Adam Mark | $90,000 | -- | |
| Wells Fargo Bank | -- | -- | |
| Terry Joey W | -- | -- | |
| Terry Joey W | $110,000 | -- | |
| Sheffield Leah S | $93,000 | -- |
Source: Public Records
Mortgage History
| Date | Status | Borrower | Loan Amount |
|---|---|---|---|
| Open | Brown Brandy | $150,228 |
Source: Public Records
Tax History Compared to Growth
Tax History
| Year | Tax Paid | Tax Assessment Tax Assessment Total Assessment is a certain percentage of the fair market value that is determined by local assessors to be the total taxable value of land and additions on the property. | Land | Improvement |
|---|---|---|---|---|
| 2025 | $2,051 | $110,089 | $6,000 | $104,089 |
| 2024 | $2,074 | $110,089 | $6,000 | $104,089 |
| 2023 | $2,108 | $100,689 | $6,000 | $94,689 |
| 2022 | $1,781 | $82,000 | $6,000 | $76,000 |
| 2021 | $1,627 | $71,096 | $6,000 | $65,096 |
| 2020 | $1,488 | $63,298 | $6,000 | $57,298 |
| 2019 | $1,421 | $58,894 | $6,000 | $52,894 |
| 2018 | $1,038 | $46,081 | $4,800 | $41,281 |
| 2017 | $966 | $42,088 | $4,800 | $37,288 |
| 2016 | $966 | $42,088 | $4,800 | $37,288 |
| 2015 | $939 | $37,574 | $4,800 | $32,774 |
| 2014 | $943 | $37,574 | $4,800 | $32,774 |
Source: Public Records
Map
Nearby Homes
- 132 Pinnacle Way
- 1423 Beulah Church Rd
- 0 Skinner Rd
- 000 Beulah Church Rd
- 442 Plowshare Rd
- The Joey Plan at Hidden Hills
- The Daniel Plan at Hidden Hills
- 105 Winston Way
- 223 Riversong Rd Unit 55
- 223 Riversong Rd
- 106 Summerfield Place Dr
- 2080 Mount Zion Rd
- 1915 Whooping Creek Church Road - Tract #1
- 1915 Whooping Creek Church Road - Tract #2
- 0 Beulah Church Rd Unit 10366052
- 142 Riversong Rd Unit 56
- 181 Riversong Rd Unit 55
- 181 Riversong Rd
- 142 Riversong Rd
- 101 Bonnie Lynn Ln
- 20 Westwood Ct
- 44 Westwood Ct
- 113 Pinnacle Way
- 123 Pinnacle Way
- 12 Westwood Ct
- 12 Westwood Ct
- 12 Westwood Ct
- 12 Westwood Ct
- 0 Westwood Ct Unit 8367686
- 41 Westwood Ct
- 27 Westwood Ct
- 35 Westwood Ct
- 65 Pinnacle Way
- 57 Pinnacle Way
- 131 Pinnacle Way
- 99 Pinnacle Way
- 15 Westwood Ct
- 33 Pinnacle Way
- 140 Pinnacle Way
- 1220 Beulah Church Rd