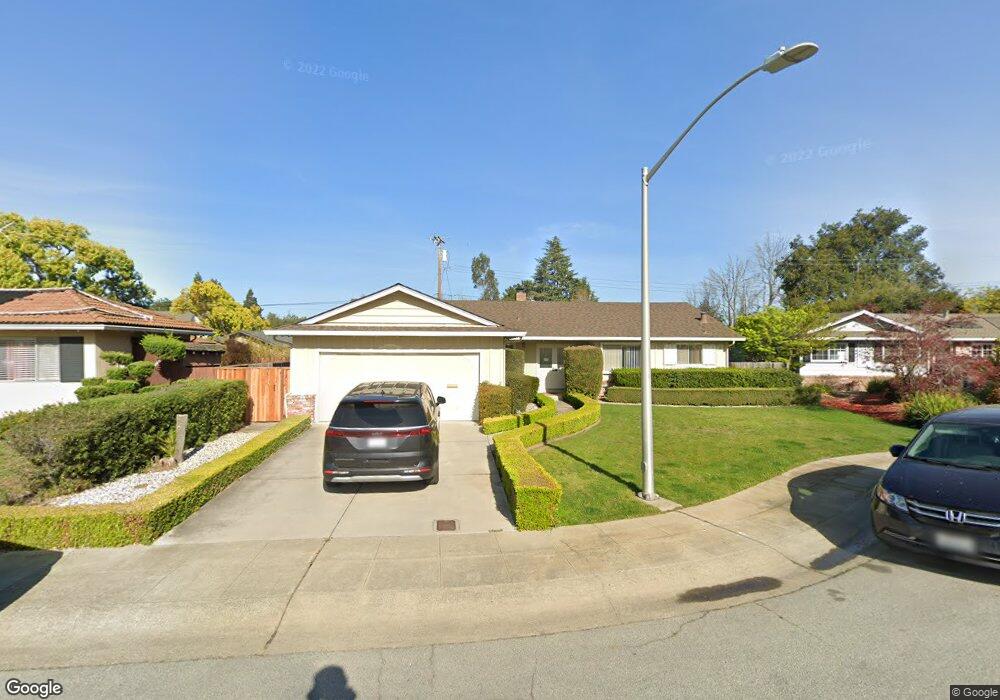
320 Barclay Ct Palo Alto, CA 94306
Charleston Meadows NeighborhoodEstimated Value: $2,933,000 - $3,345,618
4
Beds
2
Baths
1,956
Sq Ft
$1,618/Sq Ft
Est. Value
About This Home
This home is located at 320 Barclay Ct, Palo Alto, CA 94306 and is currently estimated at $3,165,155, approximately $1,618 per square foot. 320 Barclay Ct is a home located in Santa Clara County with nearby schools including Juana Briones Elementary School, Ellen Fletcher Middle, and Henry M. Gunn High School.
Ownership History
Date
Name
Owned For
Owner Type
Purchase Details
Closed on
Jul 2, 2007
Sold by
Herald Betty F
Bought by
Herald Betty F and Cochran Susan Louise
Current Estimated Value
Purchase Details
Closed on
Feb 14, 2001
Sold by
Herald Betty F
Bought by
Herald Betty F
Create a Home Valuation Report for This Property
The Home Valuation Report is an in-depth analysis detailing your home's value as well as a comparison with similar homes in the area
Home Values in the Area
Average Home Value in this Area
Purchase History
| Date | Buyer | Sale Price | Title Company |
|---|---|---|---|
| Herald Betty F | -- | None Available | |
| Herald Betty F | -- | -- |
Source: Public Records
Tax History Compared to Growth
Tax History
| Year | Tax Paid | Tax Assessment Tax Assessment Total Assessment is a certain percentage of the fair market value that is determined by local assessors to be the total taxable value of land and additions on the property. | Land | Improvement |
|---|---|---|---|---|
| 2025 | $2,457 | $132,089 | $41,554 | $90,535 |
| 2024 | $2,457 | $129,500 | $40,740 | $88,760 |
| 2023 | $2,415 | $126,962 | $39,942 | $87,020 |
| 2022 | $2,377 | $124,473 | $39,159 | $85,314 |
| 2021 | $2,327 | $122,034 | $38,392 | $83,642 |
| 2020 | $2,296 | $120,784 | $37,999 | $82,785 |
| 2019 | $2,263 | $118,416 | $37,254 | $81,162 |
| 2018 | $2,220 | $116,095 | $36,524 | $79,571 |
| 2017 | $2,178 | $113,819 | $35,808 | $78,011 |
| 2016 | $2,114 | $111,588 | $35,106 | $76,482 |
| 2015 | $2,085 | $109,913 | $34,579 | $75,334 |
| 2014 | $1,945 | $107,761 | $33,902 | $73,859 |
Source: Public Records
Map
Nearby Homes
- 4115 El Camino Real Unit 333
- 4115 El Camino Real Unit 331
- 4115 El Camino Real Unit 222
- 4115 El Camino Real Unit 332
- 26 Roosevelt Cir
- 342 Carolina Ln
- 3428 Alma Village Cir
- 4005 Villa Vera
- 4173 El Camino Real Unit 1
- 4206 Rickeys Way Unit C
- 3888 Magnolia Dr
- 4225 Park Blvd
- 756 Encina Grande Dr
- 545 Georgia Ave
- 3213 Alma St
- 339 El Verano Ave
- 278 Monroe Dr Unit 17
- 772 Paul Ave
- 3585 El Camino Real
- 771 Barron Ave
- 4115 Wilkie Way
- 310 Barclay Ct
- 325 Victoria Place
- 4107 Wilkie Way
- 315 Victoria Place
- 301 Barclay Ct
- 325 Barclay Ct
- 4117 Wilkie Way
- 315 Barclay Ct
- 301 Victoria Place
- 4108 Wilkie Way
- 330 Victoria Place
- 4104 Wilkie Way
- 4102 Wilkie Way
- 4121 Wilkie Ct
- 289 Davenport Way
- 4123 Wilkie Ct
- 320 Victoria Place
- 4119 Wilkie Ct
- 310 Victoria Place