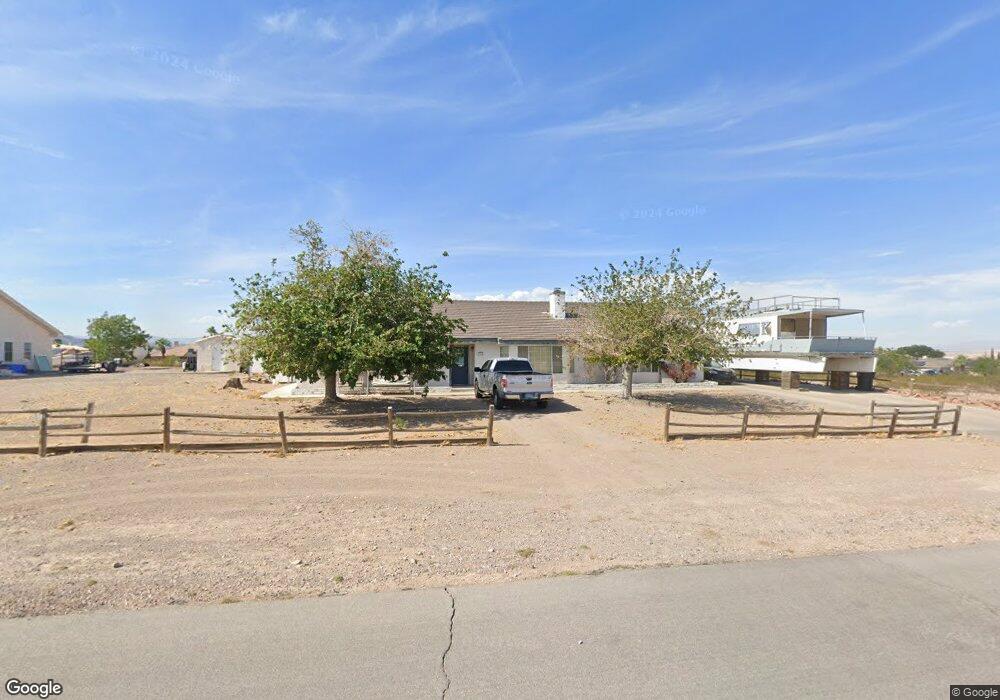
320 Kiel St Henderson, NV 89015
Foothills NeighborhoodEstimated Value: $639,360 - $769,000
3
Beds
2
Baths
2,196
Sq Ft
$329/Sq Ft
Est. Value
About This Home
This home is located at 320 Kiel St, Henderson, NV 89015 and is currently estimated at $722,840, approximately $329 per square foot. 320 Kiel St is a home located in Clark County with nearby schools including C T Sewell Elementary School, B Mahlon Brown Academy of International Studies, and Basic Academy of International Studies.
Ownership History
Date
Name
Owned For
Owner Type
Purchase Details
Closed on
Oct 1, 2003
Sold by
Moran Anmarie and Trofibio Albert C
Bought by
Trofibio Albert C
Current Estimated Value
Purchase Details
Closed on
Apr 18, 2001
Sold by
Gauvin Normand P and Gauvin Louise M
Bought by
Moran Anmarie and Trofibio Albert C
Home Financials for this Owner
Home Financials are based on the most recent Mortgage that was taken out on this home.
Original Mortgage
$192,000
Outstanding Balance
$70,251
Interest Rate
6.92%
Estimated Equity
$652,589
Purchase Details
Closed on
Mar 12, 1997
Sold by
Propster Michael J and Propster Mabel Jean
Bought by
Gauvin Normand P and Gauvin Louise M
Home Financials for this Owner
Home Financials are based on the most recent Mortgage that was taken out on this home.
Original Mortgage
$203,000
Interest Rate
7.9%
Mortgage Type
VA
Create a Home Valuation Report for This Property
The Home Valuation Report is an in-depth analysis detailing your home's value as well as a comparison with similar homes in the area
Home Values in the Area
Average Home Value in this Area
Purchase History
| Date | Buyer | Sale Price | Title Company |
|---|---|---|---|
| Trofibio Albert C | $40,000 | Land Title Of Nevada | |
| Moran Anmarie | $240,000 | Land Title | |
| Gauvin Normand P | $200,000 | National Title Company |
Source: Public Records
Mortgage History
| Date | Status | Borrower | Loan Amount |
|---|---|---|---|
| Open | Moran Anmarie | $192,000 | |
| Previous Owner | Gauvin Normand P | $203,000 | |
| Closed | Moran Anmarie | $36,000 |
Source: Public Records
Tax History Compared to Growth
Tax History
| Year | Tax Paid | Tax Assessment Tax Assessment Total Assessment is a certain percentage of the fair market value that is determined by local assessors to be the total taxable value of land and additions on the property. | Land | Improvement |
|---|---|---|---|---|
| 2025 | $2,508 | $136,795 | $63,000 | $73,795 |
| 2024 | $2,435 | $136,795 | $63,000 | $73,795 |
| 2023 | $2,435 | $126,515 | $56,000 | $70,515 |
| 2022 | $2,365 | $114,318 | $49,000 | $65,318 |
| 2021 | $2,296 | $108,021 | $45,500 | $62,521 |
| 2020 | $2,226 | $109,638 | $47,250 | $62,388 |
| 2019 | $2,161 | $102,120 | $40,250 | $61,870 |
| 2018 | $2,098 | $86,462 | $26,250 | $60,212 |
| 2017 | $2,491 | $85,939 | $24,500 | $61,439 |
| 2016 | $1,987 | $86,349 | $24,500 | $61,849 |
| 2015 | $1,983 | $75,104 | $17,500 | $57,604 |
| 2014 | $1,925 | $69,416 | $17,500 | $51,916 |
Source: Public Records
Map
Nearby Homes
- 0 Lisbon St Unit 2682026
- 259 N Milan St
- 0 Milan St
- 441 Milan St
- 408 N Lisbon St
- 428 N Lisbon St
- 132 N Lisbon St
- 0 Parawan
- 216 Night Fall Terrace
- 0 N Magic Way
- 415 Emden St
- 831 Purple Sage Terrace
- 0 Cannes St
- 308 Belfast St
- 304 Belfast St
- 263 Prairie Rose St
- 136 N Lisbon St
- 944 River Mountain Dr
- 233 Mariposa Way
- 0 N Pueblo Blvd