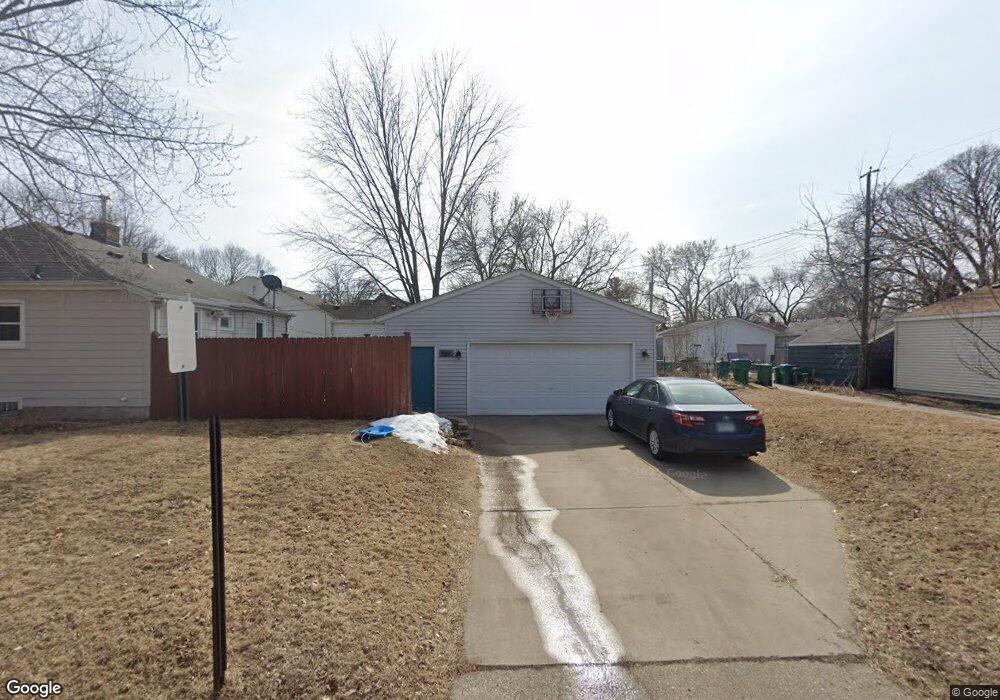
3200 Georgia Ave S Saint Louis Park, MN 55426
Lenox NeighborhoodEstimated Value: $355,706 - $393,000
3
Beds
2
Baths
1,450
Sq Ft
$256/Sq Ft
Est. Value
About This Home
This home is located at 3200 Georgia Ave S, Saint Louis Park, MN 55426 and is currently estimated at $371,427, approximately $256 per square foot. 3200 Georgia Ave S is a home located in Hennepin County with nearby schools including Peter Hobart Elementary School, St. Louis Park Middle School, and St. Louis Park High School.
Ownership History
Date
Name
Owned For
Owner Type
Purchase Details
Closed on
Jan 3, 2020
Sold by
Oeth Jared and Oeth Suttida
Bought by
Rockwell Matthew David and Rockwell Sara Louise
Current Estimated Value
Home Financials for this Owner
Home Financials are based on the most recent Mortgage that was taken out on this home.
Original Mortgage
$264,575
Outstanding Balance
$233,763
Interest Rate
3.6%
Mortgage Type
New Conventional
Estimated Equity
$137,664
Purchase Details
Closed on
Oct 1, 2014
Sold by
Higgins Rich A and Higgins Angela M
Bought by
Oeth Jared and Meeboon Suttida
Home Financials for this Owner
Home Financials are based on the most recent Mortgage that was taken out on this home.
Original Mortgage
$215,650
Interest Rate
4.21%
Mortgage Type
New Conventional
Purchase Details
Closed on
May 30, 2008
Sold by
Slechta Eric P
Bought by
Higgins Rich A and Higgins Angela M
Purchase Details
Closed on
Jun 9, 2004
Sold by
Koski John E
Bought by
Slechta Eric P and Ward Shannon M
Create a Home Valuation Report for This Property
The Home Valuation Report is an in-depth analysis detailing your home's value as well as a comparison with similar homes in the area
Home Values in the Area
Average Home Value in this Area
Purchase History
| Date | Buyer | Sale Price | Title Company |
|---|---|---|---|
| Rockwell Matthew David | $278,500 | Burnet Title | |
| Oeth Jared | $227,000 | Titlesmart Inc | |
| Higgins Rich A | $210,000 | -- | |
| Slechta Eric P | $190,000 | -- |
Source: Public Records
Mortgage History
| Date | Status | Borrower | Loan Amount |
|---|---|---|---|
| Open | Rockwell Matthew David | $264,575 | |
| Previous Owner | Oeth Jared | $215,650 |
Source: Public Records
Tax History Compared to Growth
Tax History
| Year | Tax Paid | Tax Assessment Tax Assessment Total Assessment is a certain percentage of the fair market value that is determined by local assessors to be the total taxable value of land and additions on the property. | Land | Improvement |
|---|---|---|---|---|
| 2024 | $4,160 | $313,000 | $138,000 | $175,000 |
| 2023 | $4,142 | $318,400 | $138,000 | $180,400 |
| 2022 | $4,031 | $333,400 | $137,400 | $196,000 |
| 2021 | $3,417 | $301,000 | $119,500 | $181,500 |
| 2020 | $3,577 | $269,100 | $113,900 | $155,200 |
| 2019 | $3,363 | $270,100 | $108,500 | $161,600 |
| 2018 | $3,063 | $247,700 | $103,400 | $144,300 |
| 2017 | $2,713 | $204,900 | $81,800 | $123,100 |
| 2016 | $2,676 | $196,100 | $73,900 | $122,200 |
| 2015 | $2,499 | $180,200 | $69,100 | $111,100 |
| 2014 | -- | $161,800 | $65,600 | $96,200 |
Source: Public Records
Map
Nearby Homes
- 3131 Georgia Ave S
- 3056 Florida Ave S
- 3200 Edgewood Ave S
- 3267 Library Ln
- 3216 Kentucky Ave S
- 2925 Georgia Ave S
- 2910 Edgewood Ave S
- 3124 Maryland Ave S
- 3308 Brownlow Ave
- 3251 Louisiana Ave S Unit 304
- 3251 Louisiana Ave S Unit 302
- 2852 Hampshire Ave S
- 7217 Minnetonka Blvd
- 3149 Nevada Ave S
- 3153 Nevada Ave S
- 3101 Nevada Ave S
- 2849 Jersey Ave S
- 3320 Louisiana Ave S Unit 311
- 3320 Louisiana Ave S Unit 410
- 3320 Louisiana Ave S Unit 310
- 3204 Georgia Ave S
- 3200 3200 Georgia-Avenue-s
- 3156 Georgia Ave S
- 3204 3204 Georgia-Avenue-s
- 3209 3209 Georgia-Avenue-s
- 3201 Hampshire Ave S
- 3152 Georgia Ave S
- 3212 Georgia Ave S
- 3205 Hampshire Ave S
- 3209 Hampshire Ave S
- 3157 Hampshire Ave S
- 3201 Georgia Ave S
- 3216 Georgia Ave S
- 3209 Georgia Ave S
- 3205 Georgia Ave S
- 3216 Georgia Ave S
- 3153 Hampshire Ave S
- 3144 Georgia Ave S
- 3213 Hampshire Ave S
- 3226 Georgia Ave S