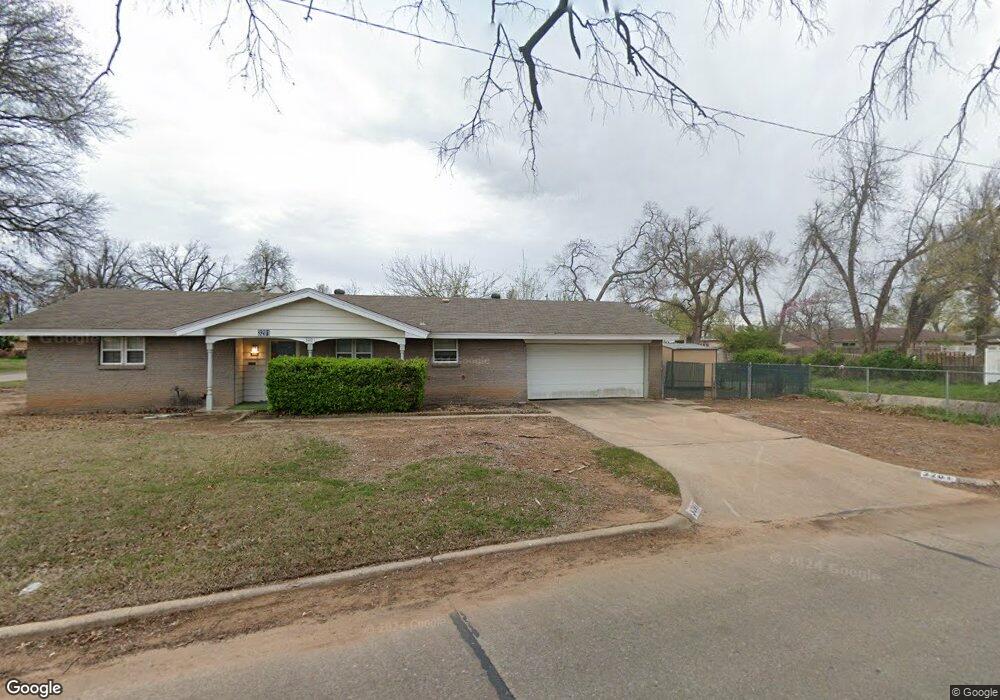
3201 Oakbrook Dr Oklahoma City, OK 73115
Estimated Value: $156,484 - $181,000
2
Beds
2
Baths
1,224
Sq Ft
$139/Sq Ft
Est. Value
About This Home
This home is located at 3201 Oakbrook Dr, Oklahoma City, OK 73115 and is currently estimated at $169,871, approximately $138 per square foot. 3201 Oakbrook Dr is a home located in Oklahoma County with nearby schools including Townsend Elementary School, Kerr Middle School, and Del City High School.
Ownership History
Date
Name
Owned For
Owner Type
Purchase Details
Closed on
Jul 23, 1999
Sold by
Brawley James and Brawley Linda C
Bought by
Girdner C Denece
Current Estimated Value
Home Financials for this Owner
Home Financials are based on the most recent Mortgage that was taken out on this home.
Original Mortgage
$50,400
Outstanding Balance
$14,017
Interest Rate
7.47%
Mortgage Type
Purchase Money Mortgage
Estimated Equity
$155,854
Purchase Details
Closed on
Feb 6, 1998
Sold by
Vaughan William E and Vaughn William E
Bought by
Brawley James and Brawley Lenda C
Create a Home Valuation Report for This Property
The Home Valuation Report is an in-depth analysis detailing your home's value as well as a comparison with similar homes in the area
Home Values in the Area
Average Home Value in this Area
Purchase History
| Date | Buyer | Sale Price | Title Company |
|---|---|---|---|
| Girdner C Denece | $63,000 | -- | |
| Brawley James | $50,000 | -- |
Source: Public Records
Mortgage History
| Date | Status | Borrower | Loan Amount |
|---|---|---|---|
| Open | Girdner C Denece | $50,400 |
Source: Public Records
Tax History Compared to Growth
Tax History
| Year | Tax Paid | Tax Assessment Tax Assessment Total Assessment is a certain percentage of the fair market value that is determined by local assessors to be the total taxable value of land and additions on the property. | Land | Improvement |
|---|---|---|---|---|
| 2024 | $1,127 | $11,018 | $2,451 | $8,567 |
| 2023 | $1,127 | $11,018 | $2,753 | $8,265 |
| 2022 | $1,110 | $11,018 | $2,992 | $8,026 |
| 2021 | $1,149 | $11,018 | $3,392 | $7,626 |
| 2020 | $1,180 | $11,018 | $3,616 | $7,402 |
| 2019 | $1,107 | $10,697 | $3,393 | $7,304 |
| 2018 | $1,087 | $10,387 | $0 | $0 |
| 2017 | $1,059 | $10,082 | $3,633 | $6,449 |
| 2016 | $1,054 | $9,789 | $3,291 | $6,498 |
| 2015 | $1,122 | $10,312 | $3,291 | $7,021 |
| 2014 | $1,134 | $10,434 | $3,291 | $7,143 |
Source: Public Records
Map
Nearby Homes
- 3128 Del View Dr
- 4809 Elmview Dr
- 4813 Elmview Dr
- 3413 Del View Dr
- 3500 Del View Dr
- 4700 Elmview Dr
- 4853 Montclair Dr
- 4704 Tempo Dr
- 4540 SE 35th St
- 4729 SE 27th St
- 4809 SE 41st St
- 4732 Princess Ln
- 4113 Vickie Dr
- 4521 SE 27th St
- 4625 SE 42nd St
- 4601 SE 26th St
- 4428 SE 38th St
- 4760 SE 23rd St
- 4428 SE 39th St
- 4620 SE 24th St
- 3205 Oakbrook Dr
- 3207 Oakbrook Dr
- 3129 Oakbrook Dr
- 4770 Woodview Dr
- 3300 Del View Dr
- 3204 Oakbrook Dr
- 3213 Oakbrook Dr
- 4800 Woodview Dr
- 3208 Oakbrook Dr
- 3125 Oakbrook Dr
- 3304 Del View Dr
- 4801 Woodview Dr
- 3217 Oakbrook Dr
- 3223 Oakbrook Dr
- 4809 Newport Dr
- 3124 Del View Dr
- 3212 Oakbrook Dr
- 3222 Oakbrook Dr
- 3308 Del View Dr
- 3124 Oakbrook Dr