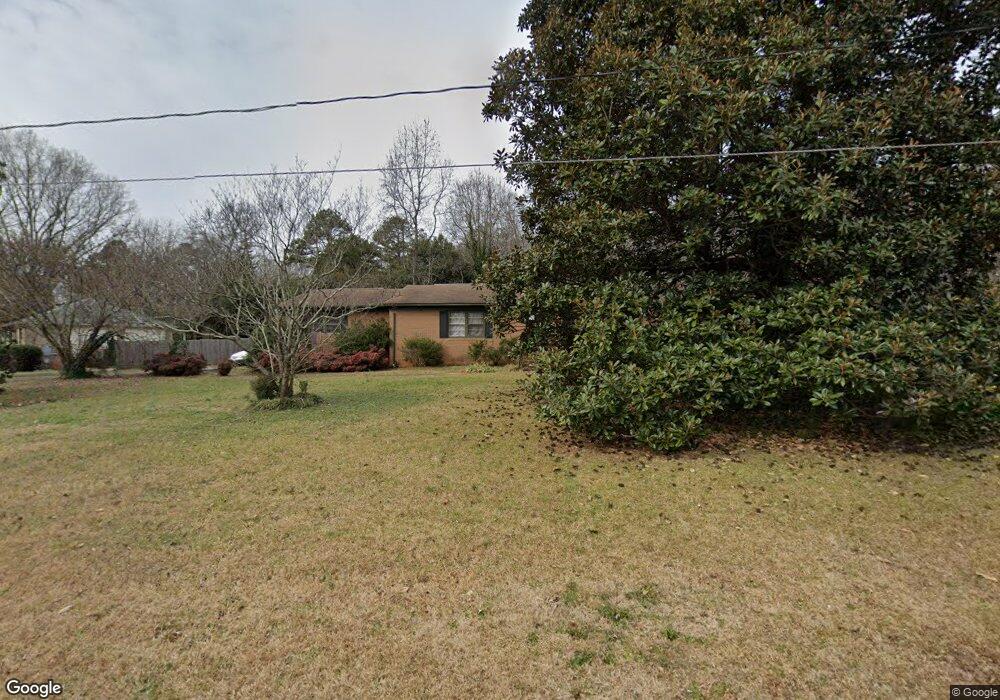
3201 Tiverton Place Charlotte, NC 28215
Hickory Grove NeighborhoodEstimated Value: $326,494 - $363,000
3
Beds
2
Baths
1,593
Sq Ft
$215/Sq Ft
Est. Value
About This Home
This home is located at 3201 Tiverton Place, Charlotte, NC 28215 and is currently estimated at $341,874, approximately $214 per square foot. 3201 Tiverton Place is a home located in Mecklenburg County with nearby schools including Northridge Middle School, Rocky River High School, and Charlotte Choice Charter.
Ownership History
Date
Name
Owned For
Owner Type
Purchase Details
Closed on
Mar 24, 2010
Sold by
Price Maurice
Bought by
Cochran Keith Edward
Current Estimated Value
Home Financials for this Owner
Home Financials are based on the most recent Mortgage that was taken out on this home.
Original Mortgage
$127,289
Outstanding Balance
$86,527
Interest Rate
5.5%
Mortgage Type
FHA
Estimated Equity
$255,347
Purchase Details
Closed on
Sep 23, 2009
Sold by
Citimortgage Inc
Bought by
Price Maurice
Home Financials for this Owner
Home Financials are based on the most recent Mortgage that was taken out on this home.
Original Mortgage
$95,000
Interest Rate
5.01%
Mortgage Type
Purchase Money Mortgage
Purchase Details
Closed on
Jul 7, 2009
Sold by
Andrews Donald and Hoyle Andrews Frederica M
Bought by
Citimortgage Inc
Create a Home Valuation Report for This Property
The Home Valuation Report is an in-depth analysis detailing your home's value as well as a comparison with similar homes in the area
Home Values in the Area
Average Home Value in this Area
Purchase History
| Date | Buyer | Sale Price | Title Company |
|---|---|---|---|
| Cochran Keith Edward | $130,000 | None Available | |
| Price Maurice | $64,000 | None Available | |
| Citimortgage Inc | $70,199 | None Available |
Source: Public Records
Mortgage History
| Date | Status | Borrower | Loan Amount |
|---|---|---|---|
| Open | Cochran Keith Edward | $127,289 | |
| Previous Owner | Price Maurice | $95,000 |
Source: Public Records
Tax History Compared to Growth
Tax History
| Year | Tax Paid | Tax Assessment Tax Assessment Total Assessment is a certain percentage of the fair market value that is determined by local assessors to be the total taxable value of land and additions on the property. | Land | Improvement |
|---|---|---|---|---|
| 2025 | $2,271 | $279,600 | $70,000 | $209,600 |
| 2024 | $2,271 | $279,600 | $70,000 | $209,600 |
| 2023 | $2,190 | $279,600 | $70,000 | $209,600 |
| 2022 | $1,862 | $179,900 | $27,000 | $152,900 |
| 2021 | $1,851 | $179,900 | $27,000 | $152,900 |
| 2020 | $1,843 | $179,900 | $27,000 | $152,900 |
| 2019 | $1,828 | $179,900 | $27,000 | $152,900 |
| 2018 | $1,573 | $114,300 | $24,700 | $89,600 |
| 2017 | $1,543 | $114,300 | $24,700 | $89,600 |
| 2016 | $1,533 | $114,300 | $24,700 | $89,600 |
| 2015 | $1,522 | $114,300 | $24,700 | $89,600 |
| 2014 | $1,778 | $133,600 | $24,700 | $108,900 |
Source: Public Records
Map
Nearby Homes
- 7108 Preston Ct
- 6217 Randy Dr
- 7415 Farm Gate Dr
- 7144 Chapparall Ln
- 6137 Meadow Rose Ln Unit 6G
- 6224 Rosecroft Dr Unit 8A
- 7330 Rose Terrace Ct Unit 16
- 7348 Rose Terrace Ct Unit 1
- 6165 Meadow Rose Ln
- 6219 Rosecroft Dr Unit J
- 7116 Hollyhouse Dr
- 6120 Meadow Rose Ln
- 7208 Applecross Ln
- 7015 Lavern St
- 7360 Rose Terrace Ct Unit 7
- 6148 Meadow Rose Ln
- 6166 Meadow Rose Ln
- 6641 Lakeside Dr
- 4312 Tantilla Cir
- 7601 Plott Rd
- 3121 Tiverton Place
- 3213 Tiverton Place
- 3200 Tiverton Place
- 6518 Williams Rd
- 3220 Tiverton Place
- 3109 Tiverton Place
- 6508 Williams Rd
- 6524 Williams Rd
- 3225 Tiverton Place
- 7136 Lakeside Dr
- 6608 Terry Ln
- 3116 Tiverton Place
- 3116 Tiverton Place Unit 3
- 3300 Tiverton Place
- 3101 Tiverton Place
- 7134 Lakeside Dr
- 6600 Terry Ln
- 6612 Terry Ln
- 7140 Lakeside Dr
- 3108 Tiverton Place