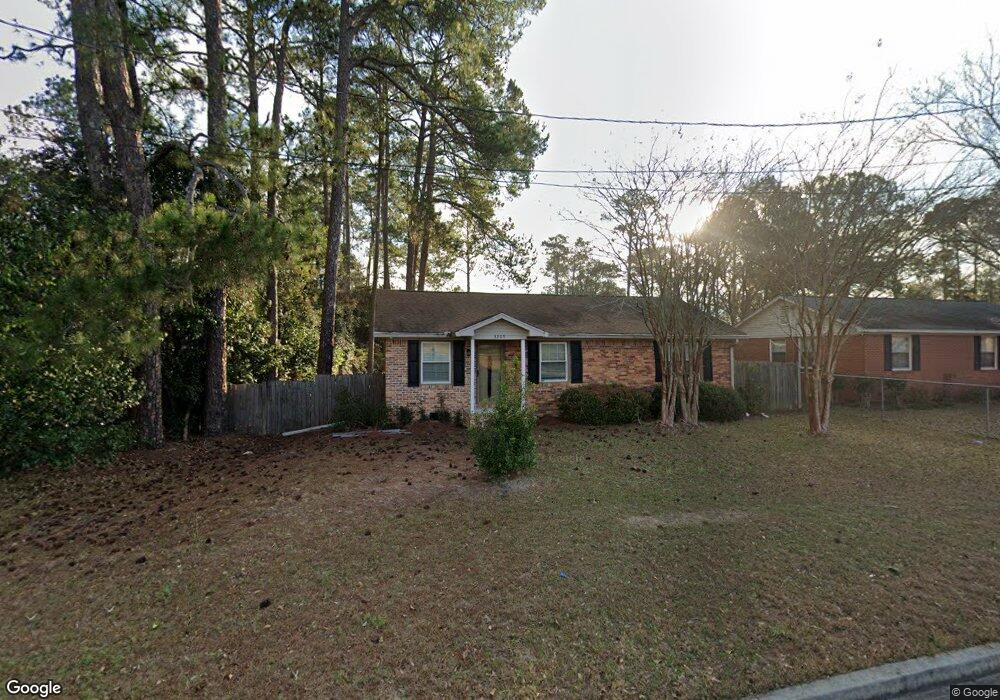
3205 Tift Ave N Tifton, GA 31794
Estimated Value: $150,000 - $173,131
3
Beds
2
Baths
1,107
Sq Ft
$145/Sq Ft
Est. Value
About This Home
This home is located at 3205 Tift Ave N, Tifton, GA 31794 and is currently estimated at $160,783, approximately $145 per square foot. 3205 Tift Ave N is a home located in Tift County with nearby schools including Northside Primary School, Charles Spencer Elementary School, and J.T. Reddick School.
Ownership History
Date
Name
Owned For
Owner Type
Purchase Details
Closed on
May 3, 2023
Sold by
Green Henry D
Bought by
Green William Mitchell
Current Estimated Value
Purchase Details
Closed on
Apr 1, 2021
Sold by
Blackstock James Edward
Bought by
Green Henry D
Purchase Details
Closed on
Apr 26, 2019
Sold by
Baldree Janie P
Bought by
Blackstock James E and Blackstock Kimberly M
Home Financials for this Owner
Home Financials are based on the most recent Mortgage that was taken out on this home.
Original Mortgage
$75,650
Interest Rate
4%
Mortgage Type
Commercial
Purchase Details
Closed on
Nov 30, 1988
Sold by
Baldree Lamar
Bought by
Baldree Janie
Purchase Details
Closed on
Sep 18, 1978
Sold by
Summerall Aaron P and Summerall Doris L
Bought by
Baldree Lamar and Baldree Janie
Create a Home Valuation Report for This Property
The Home Valuation Report is an in-depth analysis detailing your home's value as well as a comparison with similar homes in the area
Home Values in the Area
Average Home Value in this Area
Purchase History
| Date | Buyer | Sale Price | Title Company |
|---|---|---|---|
| Green William Mitchell | -- | -- | |
| Green Henry D | $34,000 | -- | |
| Blackstock James E | $85,000 | -- | |
| Baldree Janie | -- | -- | |
| Baldree Lamar | $27,000 | -- |
Source: Public Records
Mortgage History
| Date | Status | Borrower | Loan Amount |
|---|---|---|---|
| Previous Owner | Blackstock James E | $75,650 |
Source: Public Records
Tax History Compared to Growth
Tax History
| Year | Tax Paid | Tax Assessment Tax Assessment Total Assessment is a certain percentage of the fair market value that is determined by local assessors to be the total taxable value of land and additions on the property. | Land | Improvement |
|---|---|---|---|---|
| 2024 | $1,515 | $56,201 | $8,000 | $48,201 |
| 2023 | $1,611 | $33,635 | $2,880 | $30,755 |
| 2022 | $512 | $33,635 | $2,880 | $30,755 |
| 2021 | $1,063 | $28,063 | $2,880 | $25,183 |
| 2020 | $1,089 | $28,063 | $2,880 | $25,183 |
| 2019 | $1,090 | $28,063 | $2,880 | $25,183 |
| 2018 | $799 | $28,063 | $2,880 | $25,183 |
| 2017 | $817 | $28,063 | $2,880 | $25,183 |
| 2016 | $818 | $28,063 | $2,880 | $25,183 |
| 2015 | $963 | $28,063 | $2,880 | $25,183 |
| 2014 | $965 | $28,063 | $2,880 | $25,183 |
| 2013 | -- | $28,063 | $2,880 | $25,183 |
Source: Public Records
Map
Nearby Homes