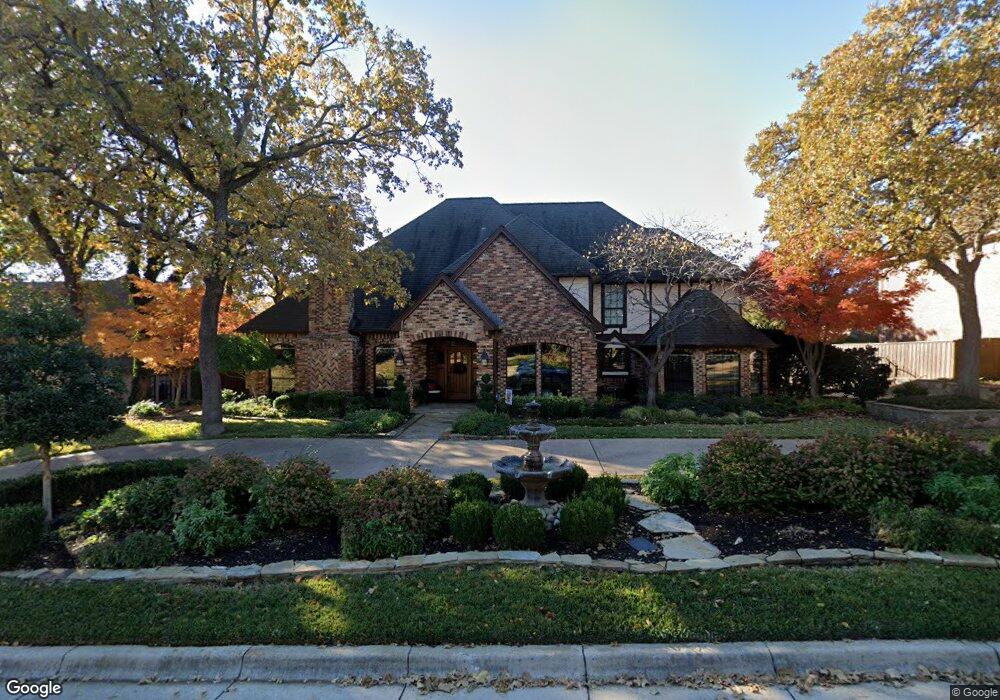
3207 Eaton Cir Colleyville, TX 76034
Estimated Value: $908,000 - $1,080,000
4
Beds
3
Baths
3,406
Sq Ft
$283/Sq Ft
Est. Value
About This Home
This home is located at 3207 Eaton Cir, Colleyville, TX 76034 and is currently estimated at $962,807, approximately $282 per square foot. 3207 Eaton Cir is a home located in Tarrant County with nearby schools including Heritage Elementary School and Colleyville Middle School.
Ownership History
Date
Name
Owned For
Owner Type
Purchase Details
Closed on
Dec 8, 2004
Sold by
Mccormack William M and Mccormack Cynthia J
Bought by
Ginevich Rostislav A and Ginevich Patsy C
Current Estimated Value
Home Financials for this Owner
Home Financials are based on the most recent Mortgage that was taken out on this home.
Original Mortgage
$284,000
Outstanding Balance
$142,322
Interest Rate
5.74%
Mortgage Type
Purchase Money Mortgage
Estimated Equity
$820,485
Purchase Details
Closed on
Jun 30, 2000
Sold by
Harbour Edwin E and Harbour Barbara A
Bought by
Mccormack William M and Mccormack Cynthia J
Purchase Details
Closed on
Aug 30, 1993
Sold by
Sears Mtg Securities Corp
Bought by
Bank Of America Ntsa and Security Pacific National Bank
Purchase Details
Closed on
Aug 27, 1993
Sold by
Bank Of America Ntsa
Bought by
Harbour Edwin E and Harbour Barbara A
Create a Home Valuation Report for This Property
The Home Valuation Report is an in-depth analysis detailing your home's value as well as a comparison with similar homes in the area
Home Values in the Area
Average Home Value in this Area
Purchase History
| Date | Buyer | Sale Price | Title Company |
|---|---|---|---|
| Ginevich Rostislav A | -- | Alamo Title Company | |
| Mccormack William M | -- | Alamo Title Company | |
| Bank Of America Ntsa | -- | Fidelity National Title Agen | |
| Harbour Edwin E | -- | Fidelity National Title Agen |
Source: Public Records
Mortgage History
| Date | Status | Borrower | Loan Amount |
|---|---|---|---|
| Open | Ginevich Rostislav A | $284,000 |
Source: Public Records
Tax History Compared to Growth
Tax History
| Year | Tax Paid | Tax Assessment Tax Assessment Total Assessment is a certain percentage of the fair market value that is determined by local assessors to be the total taxable value of land and additions on the property. | Land | Improvement |
|---|---|---|---|---|
| 2025 | $2,463 | $813,704 | $180,500 | $633,204 |
| 2024 | $2,463 | $820,400 | $180,500 | $639,900 |
| 2023 | $7,531 | $768,026 | $180,500 | $587,526 |
| 2022 | $11,456 | $621,070 | $180,500 | $440,570 |
| 2021 | $11,580 | $527,295 | $108,300 | $418,995 |
| 2020 | $10,857 | $488,594 | $108,300 | $380,294 |
| 2019 | $12,601 | $545,025 | $125,000 | $420,025 |
| 2018 | $3,083 | $518,522 | $110,000 | $408,522 |
| 2017 | $11,423 | $524,895 | $110,000 | $414,895 |
| 2016 | $10,384 | $479,853 | $110,000 | $369,853 |
| 2015 | $9,062 | $399,600 | $60,000 | $339,600 |
| 2014 | $9,062 | $399,600 | $60,000 | $339,600 |
Source: Public Records
Map
Nearby Homes
- 4300 Eaton Cir
- 2904 Hickory Hill St
- 4208 Lombardy Ct
- 2904 Hickory Hill Ln
- 3409 Langley Hill Ln
- 3409 Crossgate Cir N
- 3301 Queensbury Way W
- 3516 Lejoie Ln
- 3909 Allendale St
- 2517 San Jacinto Dr
- 4001 Fairmont Ct
- 3409 Crescent Ct
- 3901 Campania Ct
- 4309 Meandering Way
- 3013 Bent Tree Ln
- 3112 Hazlewood Ct
- 4106 Buckingham Place
- 3932 Cedar Ridge Dr
- 3713 Teal Ln
- 4728 Cabernet Cir
- 3205 Eaton Cir
- 3209 Eaton Cir
- 3204 Carisbrooke Ct
- 3202 Carisbrooke Ct
- 3206 Carisbrooke Ct
- 3204 Eaton Cir
- 3203 Eaton Cir
- 3202 Eaton Cir
- 3206 Eaton Cir
- 3200 Carisbrooke Ct
- 3200 Eaton Cir
- 4305 Martin Pkwy
- 4309 Martin Pkwy
- 3203 Carisbrooke Ct
- 3201 Wilton Woods Ct
- 3205 Carisbrooke Ct
- 4311 Martin Pkwy
- 4303 Eaton Cir
- 4301 Martin Pkwy
- 3203 Wilton Woods Ct