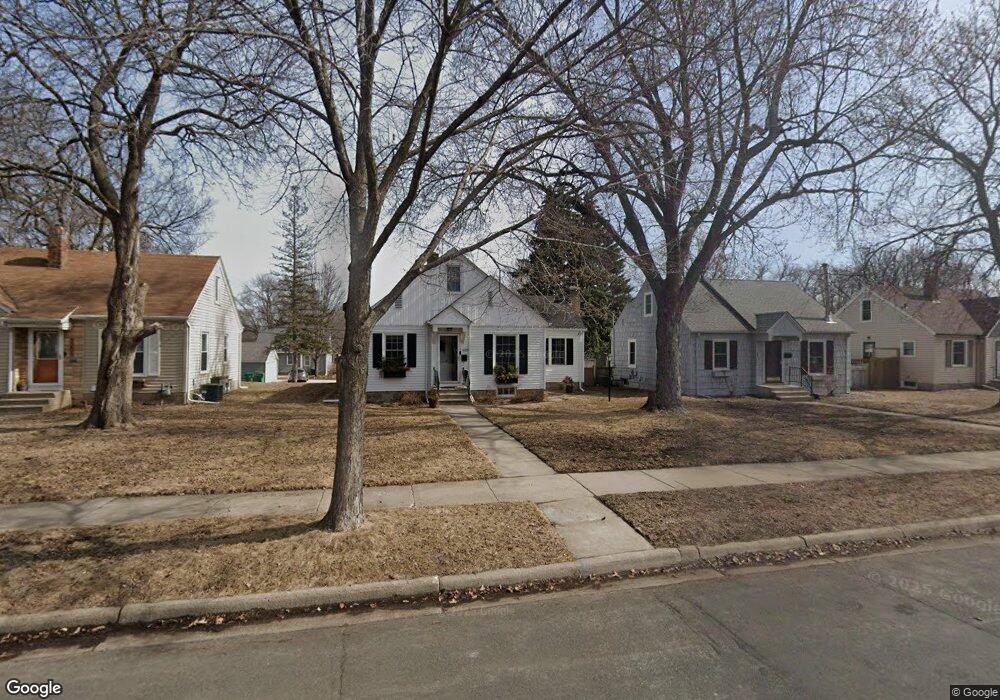
3209 3209 Florida Ave S St. Louis Park, MN 55426
Lenox NeighborhoodEstimated Value: $405,157 - $423,000
3
Beds
1
Bath
1,339
Sq Ft
$310/Sq Ft
Est. Value
About This Home
This home is located at 3209 3209 Florida Ave S, St. Louis Park, MN 55426 and is currently estimated at $414,539, approximately $309 per square foot. 3209 3209 Florida Ave S is a home located in Hennepin County with nearby schools including Peter Hobart Elementary School, St. Louis Park Middle School, and St. Louis Park High School.
Ownership History
Date
Name
Owned For
Owner Type
Purchase Details
Closed on
Sep 18, 2020
Sold by
Andrican Nathan and Andrican Molly P
Bought by
Erickson Alexandra and Freking Grayson
Current Estimated Value
Home Financials for this Owner
Home Financials are based on the most recent Mortgage that was taken out on this home.
Original Mortgage
$289,000
Interest Rate
2.8%
Mortgage Type
New Conventional
Purchase Details
Closed on
May 29, 2015
Sold by
Duda Christofer N and Duda Amy J
Bought by
Andrican Nathan
Home Financials for this Owner
Home Financials are based on the most recent Mortgage that was taken out on this home.
Original Mortgage
$231,000
Interest Rate
0.78%
Mortgage Type
New Conventional
Purchase Details
Closed on
Jul 15, 2009
Sold by
Meyer Debra
Bought by
Duda Christofer N and Blom Amy J
Purchase Details
Closed on
Feb 28, 2003
Sold by
Estate Of Dorothy A Mcelmurry
Bought by
Lindahl Urban Beth
Create a Home Valuation Report for This Property
The Home Valuation Report is an in-depth analysis detailing your home's value as well as a comparison with similar homes in the area
Home Values in the Area
Average Home Value in this Area
Purchase History
| Date | Buyer | Sale Price | Title Company |
|---|---|---|---|
| Erickson Alexandra | $340,000 | Burnet Title | |
| Andrican Nathan | $257,800 | Titlesmart Inc | |
| Duda Christofer N | $242,000 | -- | |
| Lindahl Urban Beth | $195,000 | -- | |
| Freking Grayson Grayson | $340,000 | -- |
Source: Public Records
Mortgage History
| Date | Status | Borrower | Loan Amount |
|---|---|---|---|
| Previous Owner | Erickson Alexandra | $289,000 | |
| Previous Owner | Andrican Nathan | $231,000 | |
| Closed | Freking Grayson Grayson | $289,000 |
Source: Public Records
Tax History Compared to Growth
Tax History
| Year | Tax Paid | Tax Assessment Tax Assessment Total Assessment is a certain percentage of the fair market value that is determined by local assessors to be the total taxable value of land and additions on the property. | Land | Improvement |
|---|---|---|---|---|
| 2024 | $5,013 | $369,200 | $138,000 | $231,200 |
| 2023 | $4,977 | $376,500 | $138,000 | $238,500 |
| 2022 | $4,480 | $375,900 | $137,400 | $238,500 |
| 2021 | $4,020 | $340,400 | $119,500 | $220,900 |
| 2020 | $4,169 | $311,200 | $113,900 | $197,300 |
| 2019 | $3,910 | $309,800 | $108,500 | $201,300 |
| 2018 | $3,777 | $283,200 | $103,400 | $179,800 |
| 2017 | $3,280 | $241,400 | $81,800 | $159,600 |
| 2016 | $3,138 | $224,800 | $73,900 | $150,900 |
| 2015 | $3,289 | $227,900 | $69,100 | $158,800 |
| 2014 | -- | $209,400 | $65,600 | $143,800 |
Source: Public Records
Map
Nearby Homes
- 3200 Edgewood Ave S
- 3131 Georgia Ave S
- 3056 Florida Ave S
- 3267 Library Ln
- 3216 Kentucky Ave S
- 2925 Georgia Ave S
- 3308 Brownlow Ave
- 2910 Edgewood Ave S
- 3379 Brownlow Ave
- 3251 Louisiana Ave S Unit 304
- 3251 Louisiana Ave S Unit 302
- 3106 Zarthan Ave S
- 2852 Hampshire Ave S
- 5831 W Lake St
- 3124 Maryland Ave S
- 2921 Blackstone Ave
- 3320 Louisiana Ave S Unit 311
- 3320 Louisiana Ave S Unit 410
- 3320 Louisiana Ave S Unit 310
- 3320 Louisiana Ave S Unit 112
- 3209 Florida Ave S
- 3208 Florida Ave S
- 3213 Florida Ave S
- 3205 Florida Ave S
- 3212 Florida Ave S
- 3204 Florida Ave S
- 3216 Florida Ave S
- 3201 Florida Ave S
- 3200 Florida Ave S
- 3201 Florida Ave S
- 3220 Florida Ave S
- 3225 3225 Florida Ave S
- 3157 3157 Florida-Avenue-s
- 3157 3157 S Florida-Avenue-s
- 3157 3157 Florida Ave S
- 3224 Florida Ave S
- 3225 Florida Ave S
- 3157 Florida Ave S
- 3156 Florida Ave S
- 3208 Edgewood Ave S