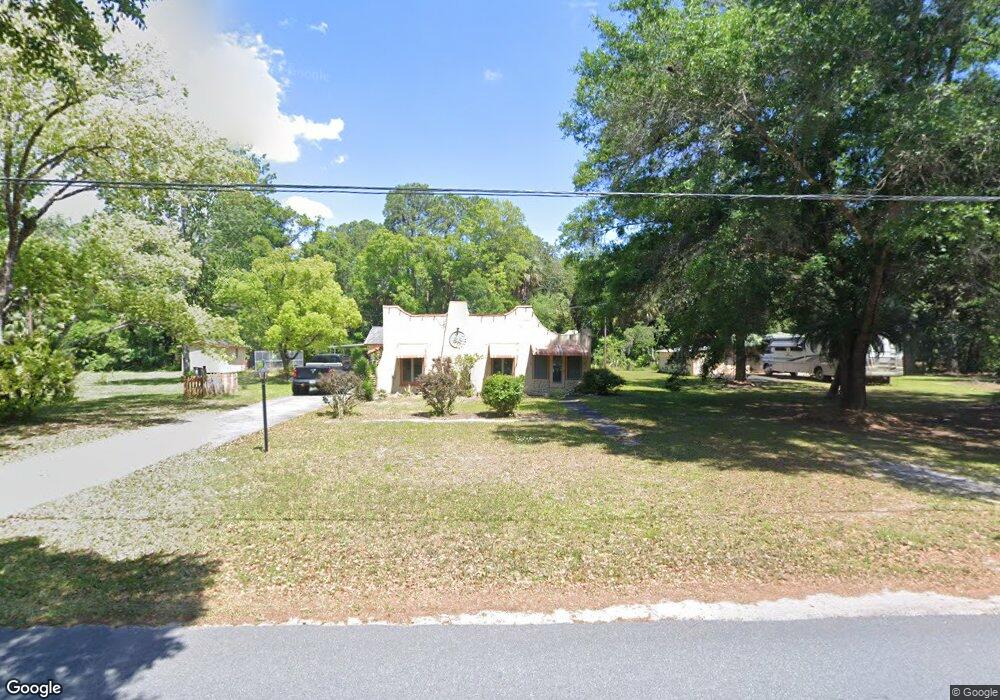
3209 S Michigan Blvd Homosassa, FL 34448
Estimated Value: $178,000 - $215,000
2
Beds
1
Bath
1,324
Sq Ft
$149/Sq Ft
Est. Value
About This Home
This home is located at 3209 S Michigan Blvd, Homosassa, FL 34448 and is currently estimated at $196,844, approximately $148 per square foot. 3209 S Michigan Blvd is a home located in Citrus County with nearby schools including Homosassa Elementary School, Crystal River High School, and Crystal River Middle School.
Ownership History
Date
Name
Owned For
Owner Type
Purchase Details
Closed on
Dec 20, 2019
Sold by
Taylor Elaine M
Bought by
Camp Gerald R
Current Estimated Value
Purchase Details
Closed on
Mar 27, 2017
Sold by
Duchesne Lorraine J and The Lorraine J Duchesne Revoca
Bought by
Taylor Robert K and Taylor Elaine M
Purchase Details
Closed on
Jan 16, 2011
Sold by
Duchesne Roland R and Duchesne Lorraine J
Bought by
Duchesne Lorraine J and The Lorraine J Duchesne Revoca
Purchase Details
Closed on
Jan 1, 2011
Bought by
Taylor Robert K and Taylor Elaine M
Purchase Details
Closed on
Mar 29, 2001
Sold by
Dorraugh Shelby J Bandy
Bought by
Duchesne Roland R and Duchesne Loaraine J
Purchase Details
Closed on
Jan 1, 1997
Bought by
Taylor Robert K and Taylor Elaine M
Purchase Details
Closed on
Apr 1, 1994
Bought by
Taylor Robert K and Taylor Elaine M
Purchase Details
Closed on
Mar 1, 1987
Bought by
Taylor Robert K and Taylor Elaine M
Create a Home Valuation Report for This Property
The Home Valuation Report is an in-depth analysis detailing your home's value as well as a comparison with similar homes in the area
Home Values in the Area
Average Home Value in this Area
Purchase History
| Date | Buyer | Sale Price | Title Company |
|---|---|---|---|
| Camp Gerald R | $97,000 | First International Ttl Inc | |
| Taylor Robert K | $112,000 | First Intl Title Inc | |
| Duchesne Lorraine J | -- | None Available | |
| Taylor Robert K | $100 | -- | |
| Duchesne Roland R | $40,000 | -- | |
| Taylor Robert K | $11,500 | -- | |
| Taylor Robert K | $40,000 | -- | |
| Taylor Robert K | $39,000 | -- |
Source: Public Records
Tax History Compared to Growth
Tax History
| Year | Tax Paid | Tax Assessment Tax Assessment Total Assessment is a certain percentage of the fair market value that is determined by local assessors to be the total taxable value of land and additions on the property. | Land | Improvement |
|---|---|---|---|---|
| 2024 | $914 | $90,212 | -- | -- |
| 2023 | $914 | $87,584 | $0 | $0 |
| 2022 | $855 | $85,033 | $0 | $0 |
| 2021 | $818 | $82,556 | $0 | $0 |
| 2020 | $751 | $81,416 | $9,080 | $72,336 |
| 2019 | $1,239 | $70,851 | $9,080 | $61,771 |
| 2018 | $1,131 | $64,103 | $9,080 | $55,023 |
| 2017 | $297 | $37,974 | $9,080 | $28,894 |
| 2016 | $291 | $37,193 | $9,080 | $28,113 |
| 2015 | $281 | $36,934 | $9,070 | $27,864 |
| 2014 | $283 | $36,641 | $8,641 | $28,000 |
Source: Public Records
Map
Nearby Homes
- 8107 W Mayfair Dr
- 3404 S Michigan Blvd
- 3411 S Michigan Blvd
- 3409 S Suncoast Blvd
- 8374 W Mayfair Dr
- 8275 W Windhaven Place
- 8118 W Windhaven Place
- 8178 W Windhaven Place
- 8030 W Hawthorne Place
- 8090 & 8112 W Mistflower Place
- 8145 W Fern Place
- 3386 S Indiana Ave
- 8696 W Faust Ln
- 8048 W Fern Place
- 8733 W Elkhorn Dr
- 7941 W Ox Eye Place
- 3919 S Illinois Terrace
- 3740 S Eastpark Way
- 7898 W Fern Place
- 7860 W Homosassa Trail
- 3209 S Michigan Blvd
- 3224 S Michigan Blvd
- 8465 W Ivy Place
- 3249 S Michigan Blvd
- 3171 S Michigan Blvd
- 3208 S Detroit Way
- 3260 S Michigan Blvd
- 3257 S Canadian Way
- 3190 S Michigan Blvd
- 3241 S Canadian Way
- 3280 S Michigan Blvd
- 3291 S Canadian Way
- 3259 S Michigan Blvd
- 3290 S Michigan Blvd
- 3290 S Canadian Way
- 3279 S Suncoast Blvd
- 3328 S Canadian Way
- 3305 S Michigan Blvd
- 3289 S Suncoast Blvd
- 3291 S Suncoast Blvd