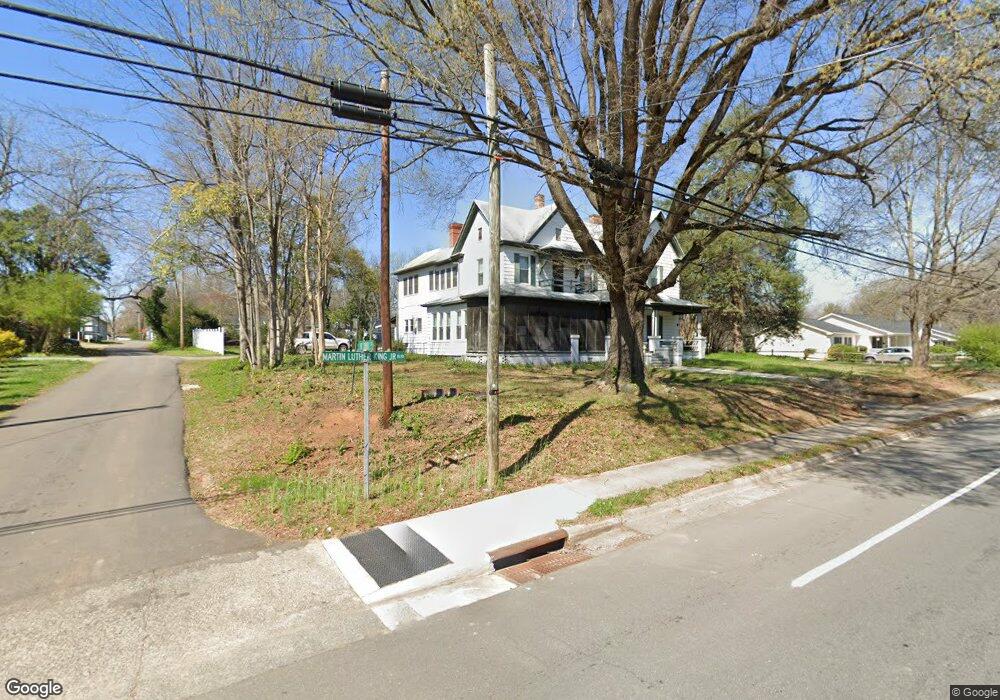
321 Martin Luther King jr Blvd Siler City, NC 27344
Estimated Value: $176,000 - $375,000
5
Beds
2
Baths
3,230
Sq Ft
$87/Sq Ft
Est. Value
About This Home
This home is located at 321 Martin Luther King jr Blvd, Siler City, NC 27344 and is currently estimated at $280,484, approximately $86 per square foot. 321 Martin Luther King jr Blvd is a home located in Chatham County with nearby schools including Virginia Cross Elementary School, Chatham Middle, and Jordan Matthews High.
Ownership History
Date
Name
Owned For
Owner Type
Purchase Details
Closed on
May 5, 2019
Sold by
Thornburg Hughes Cynthia Thornburg and Thornburg Leith Term
Bought by
Pocock Mary B and Pocock Lowell B
Current Estimated Value
Home Financials for this Owner
Home Financials are based on the most recent Mortgage that was taken out on this home.
Original Mortgage
$116,400
Outstanding Balance
$101,705
Interest Rate
4%
Mortgage Type
New Conventional
Estimated Equity
$178,779
Purchase Details
Closed on
Nov 5, 2018
Sold by
Thornburg Tillie Paul
Bought by
Thornburg Thornburg Tollie Paul Tollie Paul and Thornburg Hughes Cynthiia
Purchase Details
Closed on
Dec 30, 2012
Sold by
Thornburg W Hugh
Bought by
Thornburg Tillie Paul
Create a Home Valuation Report for This Property
The Home Valuation Report is an in-depth analysis detailing your home's value as well as a comparison with similar homes in the area
Home Values in the Area
Average Home Value in this Area
Purchase History
| Date | Buyer | Sale Price | Title Company |
|---|---|---|---|
| Pocock Mary B | $120,000 | None Available | |
| Thornburg Thornburg Tollie Paul Tollie Paul | $5,000 | None Available | |
| Thornburg Tillie Paul | -- | -- |
Source: Public Records
Mortgage History
| Date | Status | Borrower | Loan Amount |
|---|---|---|---|
| Open | Pocock Mary B | $116,400 |
Source: Public Records
Tax History Compared to Growth
Tax History
| Year | Tax Paid | Tax Assessment Tax Assessment Total Assessment is a certain percentage of the fair market value that is determined by local assessors to be the total taxable value of land and additions on the property. | Land | Improvement |
|---|---|---|---|---|
| 2025 | $2,415 | $189,391 | $18,270 | $171,121 |
| 2024 | $2,415 | $122,114 | $17,400 | $104,714 |
| 2023 | $1,545 | $122,114 | $17,400 | $104,714 |
| 2022 | $1,471 | $122,114 | $17,400 | $104,714 |
| 2021 | $1,471 | $122,114 | $17,400 | $104,714 |
| 2020 | $1,845 | $152,457 | $12,500 | $139,957 |
| 2019 | $1,845 | $152,457 | $12,500 | $139,957 |
| 2018 | $0 | $152,457 | $12,500 | $139,957 |
| 2017 | $868 | $152,457 | $12,500 | $139,957 |
| 2016 | $849 | $152,457 | $12,500 | $139,957 |
| 2015 | $840 | $152,457 | $12,500 | $139,957 |
| 2014 | $350 | $152,457 | $12,500 | $139,957 |
| 2013 | -- | $152,457 | $12,500 | $139,957 |
Source: Public Records
Map
Nearby Homes
- 409 E 10th St
- TBD E 3rd St
- 00 U S Highway 64
- 17880 U S Highway 64
- 519 W Raleigh St
- 303 W Dolphin St
- 1707 N Chatham Ave
- 803 Woodland Dr
- 806 Cliftwood Dr
- Tbd W 3rd St
- 701 S Chatham Ave
- 726 S 2nd Ave
- 513 W Glendale St
- 1004 Candlewood Cir
- 1501 Duet Dr
- 1007 Driftwood Dr
- 128 Olde Manor Ct
- 0 W 3rd St
- 1201 Red Sunset Place
- 1306 Sunset Dr
- 321 M l King jr Blvd
- 321 Martin Luther King Junior Blvd
- 323 M l King jr Blvd
- 326 E 6th St
- 503 N 4th Ave
- 320 E 6th St
- 325 M l King jr Blvd
- 312 E 6th St
- 330 E 6th St
- 312 M l King jr Blvd
- 310 Martin Luther King Junior Blvd
- 301 M l King jr Blvd
- 301 Martin Luther King jr Blvd
- 328 M l King jr Blvd
- 310 M l King jr Blvd
- 510 N 3rd Ave
- 410 N 3rd Ct
- 319 E 6th St
- 325 E 6th St
- 416 N 3rd Ave