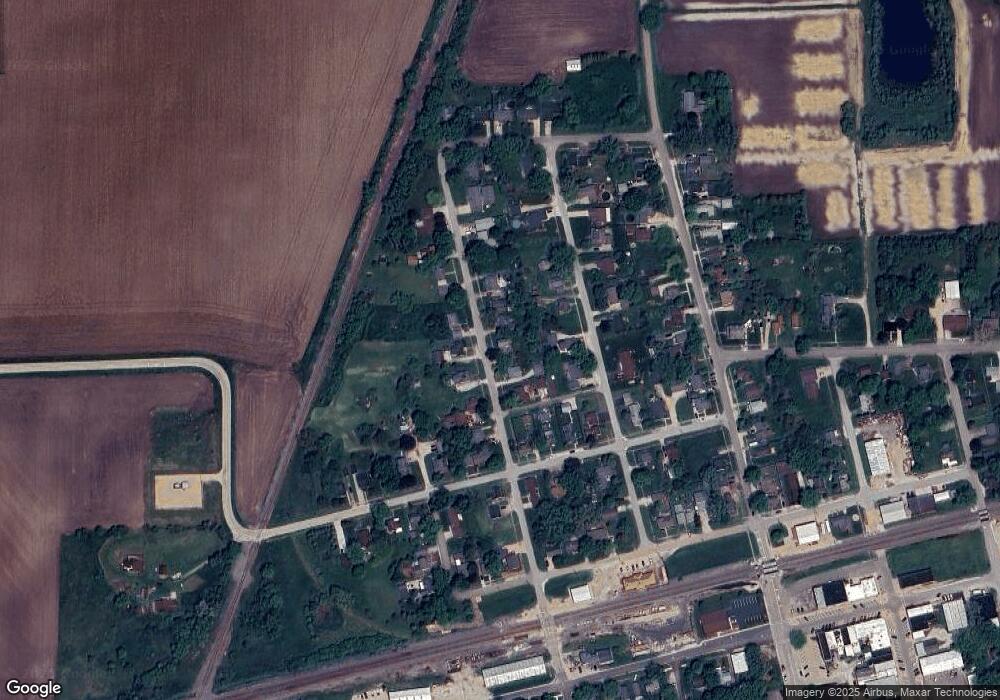
321 N 3rd St Earlville, IL 60518
Estimated Value: $122,000 - $250,000
3
Beds
2
Baths
1,300
Sq Ft
$138/Sq Ft
Est. Value
About This Home
This home is located at 321 N 3rd St, Earlville, IL 60518 and is currently estimated at $179,697, approximately $138 per square foot. 321 N 3rd St is a home located in LaSalle County with nearby schools including Earlville Elementary School and Earlville Junior/Senior High School.
Ownership History
Date
Name
Owned For
Owner Type
Purchase Details
Closed on
Feb 23, 2007
Sold by
Ebersohl Angelica M
Bought by
Dean Michelle M
Current Estimated Value
Purchase Details
Closed on
Sep 9, 2005
Sold by
Dela Cruz Feliciano C and Dela Cruz Magdalena T
Bought by
Ebersohl Angelica
Home Financials for this Owner
Home Financials are based on the most recent Mortgage that was taken out on this home.
Original Mortgage
$70,000
Interest Rate
4.75%
Mortgage Type
Adjustable Rate Mortgage/ARM
Create a Home Valuation Report for This Property
The Home Valuation Report is an in-depth analysis detailing your home's value as well as a comparison with similar homes in the area
Home Values in the Area
Average Home Value in this Area
Purchase History
| Date | Buyer | Sale Price | Title Company |
|---|---|---|---|
| Dean Michelle M | $68,549 | None Available | |
| Ebersohl Angelica | $59,900 | None Available |
Source: Public Records
Mortgage History
| Date | Status | Borrower | Loan Amount |
|---|---|---|---|
| Previous Owner | Ebersohl Angelica | $70,000 |
Source: Public Records
Tax History Compared to Growth
Tax History
| Year | Tax Paid | Tax Assessment Tax Assessment Total Assessment is a certain percentage of the fair market value that is determined by local assessors to be the total taxable value of land and additions on the property. | Land | Improvement |
|---|---|---|---|---|
| 2024 | $3,861 | $46,061 | $3,308 | $42,753 |
| 2023 | $3,537 | $40,686 | $2,922 | $37,764 |
| 2022 | $3,314 | $36,480 | $6,189 | $30,291 |
| 2021 | $3,384 | $35,856 | $6,083 | $29,773 |
| 2020 | $3,284 | $34,782 | $5,901 | $28,881 |
| 2019 | $3,220 | $33,278 | $5,646 | $27,632 |
| 2018 | $2,862 | $28,773 | $5,429 | $23,344 |
| 2017 | $2,661 | $26,260 | $4,955 | $21,305 |
| 2016 | $2,548 | $24,542 | $4,631 | $19,911 |
| 2015 | $2,463 | $23,514 | $4,437 | $19,077 |
| 2012 | -- | $27,627 | $5,213 | $22,414 |
Source: Public Records
Map
Nearby Homes
