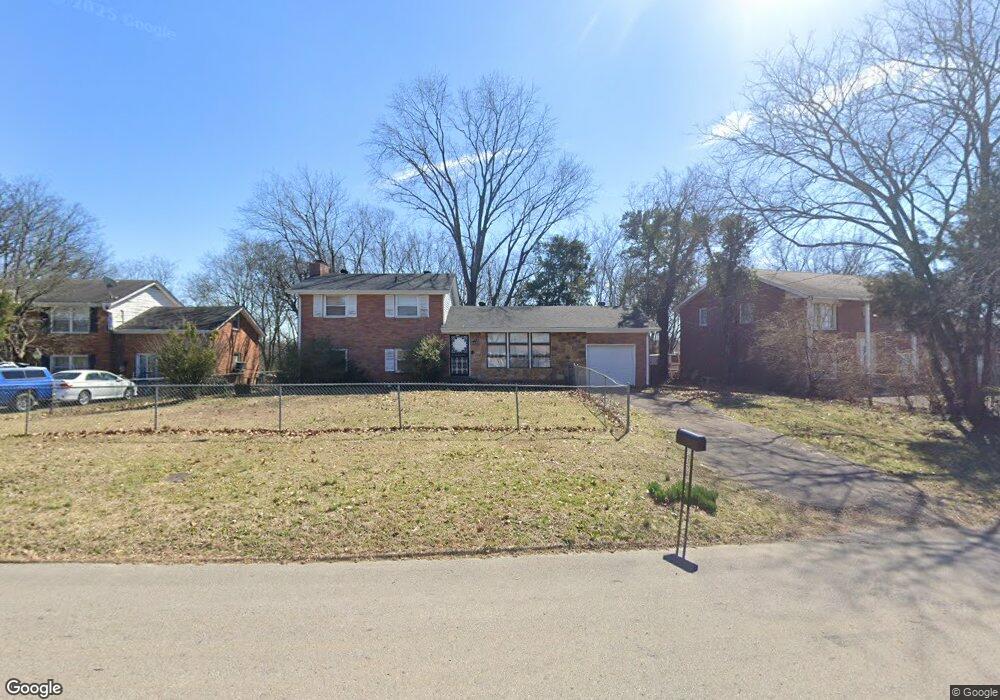
3210 Wilmoth Ct Nashville, TN 37207
Parkwood Estates NeighborhoodEstimated Value: $323,000 - $351,000
3
Beds
2
Baths
1,794
Sq Ft
$190/Sq Ft
Est. Value
About This Home
This home is located at 3210 Wilmoth Ct, Nashville, TN 37207 and is currently estimated at $340,593, approximately $189 per square foot. 3210 Wilmoth Ct is a home located in Davidson County with nearby schools including Chadwell Elementary School, Jere Baxter Middle, and Maplewood Comprehensive High School.
Ownership History
Date
Name
Owned For
Owner Type
Purchase Details
Closed on
Dec 6, 2023
Sold by
Amos Karen Y
Bought by
Finch Tienikanasha and Bishi Yvonne R
Current Estimated Value
Purchase Details
Closed on
Nov 25, 2014
Sold by
Jones Kimberly D
Bought by
Bishi Yvonne R and Amos Karen Y
Create a Home Valuation Report for This Property
The Home Valuation Report is an in-depth analysis detailing your home's value as well as a comparison with similar homes in the area
Home Values in the Area
Average Home Value in this Area
Purchase History
| Date | Buyer | Sale Price | Title Company |
|---|---|---|---|
| Finch Tienikanasha | -- | None Listed On Document | |
| Amos Karen Y | -- | None Listed On Document | |
| Bishi Yvonne R | -- | None Available |
Source: Public Records
Tax History Compared to Growth
Tax History
| Year | Tax Paid | Tax Assessment Tax Assessment Total Assessment is a certain percentage of the fair market value that is determined by local assessors to be the total taxable value of land and additions on the property. | Land | Improvement |
|---|---|---|---|---|
| 2024 | $1,779 | $54,675 | $11,250 | $43,425 |
| 2023 | $1,779 | $54,675 | $11,250 | $43,425 |
| 2022 | $579 | $54,675 | $11,250 | $43,425 |
| 2021 | $1,798 | $54,675 | $11,250 | $43,425 |
| 2020 | $1,570 | $37,200 | $8,250 | $28,950 |
| 2019 | $1,174 | $37,200 | $8,250 | $28,950 |
| 2018 | $1,174 | $37,200 | $8,250 | $28,950 |
| 2017 | $1,174 | $37,200 | $8,250 | $28,950 |
| 2016 | $1,162 | $25,725 | $5,000 | $20,725 |
| 2015 | $1,162 | $25,725 | $5,000 | $20,725 |
| 2014 | $1,162 | $25,725 | $5,000 | $20,725 |
Source: Public Records
Map
Nearby Homes
- 3205 Leswood Ln
- 3214 Doverside Dr
- 3225 Sennadale Ln
- 3229 Moorewood Dr
- 3103 Brick Church Pike
- 3240 Doverside Dr
- 3070 Richmond Hill Dr
- 3061 Richmond Hill Dr
- 3247 Masonwood Dr
- 388 Ewing Dr
- 0 Ewing Dr Unit RTC2807170
- 0 Ewing Dr Unit RTC3011325
- 0 Ewing Dr Unit RTC2989232
- 3313 Leondale Terrace
- 430 Ewing Dr
- 439 Ewing Dr
- 3320 Chesapeake Cir
- 3205 Ewingdale Dr
- 3253 Rainwood Dr
- 116 Tiger Cir
- 3206 Wilmoth Ct
- 3212 Wilmoth Ct
- 3204 Wilmoth Ct
- 3126 Wilmoth Rd
- 3124 Wilmoth Rd
- 3214 Wilmoth Ct
- 3211 Wilmoth Ct
- 3209 Wilmoth Ct
- 3128 Wilmoth Rd
- 3122 Wilmoth Rd
- 3216 Wilmoth Ct
- 3213 Wilmoth Ct
- 3207 Wilmoth Ct
- 3200 Wilmoth Ct
- 3120 Wilmoth Rd
- 3215 Wilmoth Ct
- 3205 Wilmoth Ct
- 3203 Leswood Ln
- 3224 Spears Rd
- 3222 Spears Rd