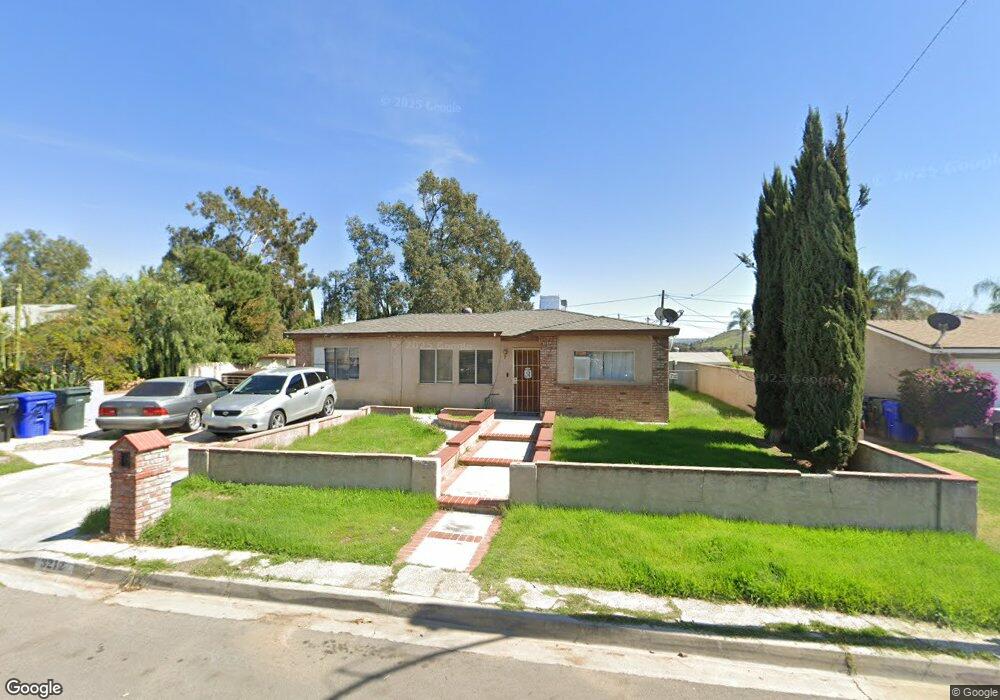
3212 Pontiac Ave Riverside, CA 92509
Estimated Value: $415,000 - $510,000
2
Beds
1
Bath
1,020
Sq Ft
$444/Sq Ft
Est. Value
About This Home
This home is located at 3212 Pontiac Ave, Riverside, CA 92509 and is currently estimated at $452,525, approximately $443 per square foot. 3212 Pontiac Ave is a home located in Riverside County with nearby schools including Ina Arbuckle Elementary School, Mission Middle School, and Rubidoux High School.
Ownership History
Date
Name
Owned For
Owner Type
Purchase Details
Closed on
Feb 2, 2005
Sold by
Carter Edward
Bought by
Carter Edward
Current Estimated Value
Home Financials for this Owner
Home Financials are based on the most recent Mortgage that was taken out on this home.
Original Mortgage
$110,000
Interest Rate
5.81%
Mortgage Type
Stand Alone Refi Refinance Of Original Loan
Purchase Details
Closed on
Jan 10, 2002
Sold by
Carter Edward Dee
Bought by
Carter Edward
Home Financials for this Owner
Home Financials are based on the most recent Mortgage that was taken out on this home.
Original Mortgage
$89,600
Interest Rate
7.99%
Mortgage Type
Purchase Money Mortgage
Purchase Details
Closed on
Aug 22, 1996
Sold by
Hud
Bought by
Carter Edward Dee
Home Financials for this Owner
Home Financials are based on the most recent Mortgage that was taken out on this home.
Original Mortgage
$60,050
Interest Rate
8.06%
Mortgage Type
FHA
Purchase Details
Closed on
Dec 28, 1995
Sold by
Gmac Mtg Corp Of Pa
Bought by
Hud
Create a Home Valuation Report for This Property
The Home Valuation Report is an in-depth analysis detailing your home's value as well as a comparison with similar homes in the area
Home Values in the Area
Average Home Value in this Area
Purchase History
| Date | Buyer | Sale Price | Title Company |
|---|---|---|---|
| Carter Edward | -- | Fidelity National Title | |
| Carter Edward | -- | Fidelity National Title | |
| Carter Edward Dee | $60,500 | Stewart Title | |
| Hud | -- | First American Title Ins Co |
Source: Public Records
Mortgage History
| Date | Status | Borrower | Loan Amount |
|---|---|---|---|
| Closed | Carter Edward | $110,000 | |
| Closed | Carter Edward | $89,600 | |
| Previous Owner | Carter Edward Dee | $60,050 |
Source: Public Records
Tax History Compared to Growth
Tax History
| Year | Tax Paid | Tax Assessment Tax Assessment Total Assessment is a certain percentage of the fair market value that is determined by local assessors to be the total taxable value of land and additions on the property. | Land | Improvement |
|---|---|---|---|---|
| 2025 | $1,231 | $105,822 | $48,840 | $56,982 |
| 2023 | $1,231 | $101,715 | $46,945 | $54,770 |
| 2022 | $1,193 | $99,722 | $46,025 | $53,697 |
| 2021 | $1,190 | $97,768 | $45,123 | $52,645 |
| 2020 | $1,178 | $96,767 | $44,661 | $52,106 |
| 2019 | $1,154 | $94,871 | $43,786 | $51,085 |
| 2018 | $1,117 | $93,012 | $42,928 | $50,084 |
| 2017 | $1,106 | $91,189 | $42,087 | $49,102 |
| 2016 | $1,090 | $89,402 | $41,262 | $48,140 |
| 2015 | $1,075 | $88,062 | $40,644 | $47,418 |
| 2014 | $1,006 | $86,339 | $39,849 | $46,490 |
Source: Public Records
Map
Nearby Homes
- 3319 Avalon St Unit 78
- 3319 Avalon St Unit 22
- 3319 Avalon St Unit Space 62
- 3319 Avalon St Unit 39
- 5479 34th St Unit 2
- 7560 La Canada Dr
- 7536 La Canada Dr
- 7524 La Canada Dr
- 5617 29th St
- 3350 Jennie St
- 2885 Demeter Place
- 3713 Packard St
- Residence Two Plan at Emerald Ridge - Skyline
- Residence One Plan at Emerald Ridge - Overlook
- Residence Four Plan at Emerald Ridge - Overlook
- Residence Three Plan at Emerald Ridge - Skyline
- Residence Four Plan at Emerald Ridge - Skyline
- Residence Three Plan at Emerald Ridge - Overlook
- Residence Two Plan at Emerald Ridge - Overlook
- Residence One Plan at Emerald Ridge - Skyline
- 3228 Pontiac Ave
- 3200 Pontiac Ave
- 3238 Pontiac Ave
- 3201 Pontiac Ave
- 3192 Pontiac Ave
- 3219 Pontiac Ave
- 3246 Pontiac Ave
- 3213 Rubidoux Blvd
- 3201 Rubidoux Blvd
- 3191 Rubidoux Blvd
- 3233 Pontiac Ave
- 3241 Pontiac Ave
- 3254 Pontiac Ave
- 3183 Rubidoux Blvd
- 3249 Pontiac Ave
- 3260 Pontiac Ave
- 3257 Pontiac Ave
- 3071 Rubidoux Blvd
- 3270 Pontiac Ave
- 5653 Raye St