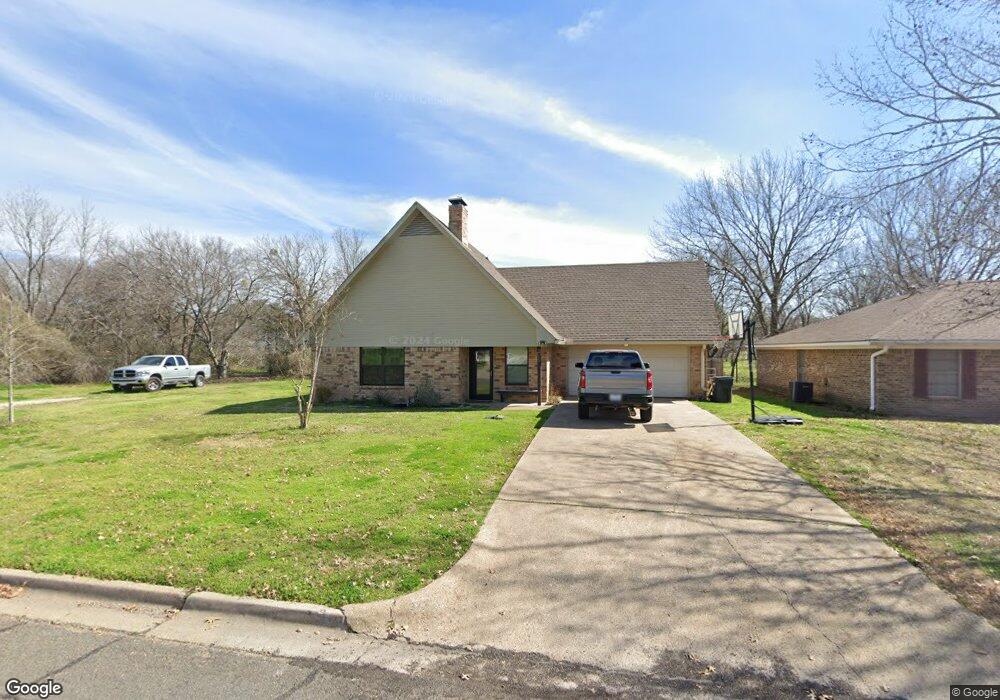
3213 Louis Ave Corsicana, TX 75110
Estimated Value: $231,913 - $248,000
2
Beds
2
Baths
1,654
Sq Ft
$145/Sq Ft
Est. Value
About This Home
This home is located at 3213 Louis Ave, Corsicana, TX 75110 and is currently estimated at $239,228, approximately $144 per square foot. 3213 Louis Ave is a home located in Navarro County with nearby schools including Corsicana High School and William Tyndale Christian Academy.
Ownership History
Date
Name
Owned For
Owner Type
Purchase Details
Closed on
Jul 16, 2018
Sold by
Hampel Scott and Hampel Rhetta
Bought by
Updegraff Travis L
Current Estimated Value
Home Financials for this Owner
Home Financials are based on the most recent Mortgage that was taken out on this home.
Original Mortgage
$107,000
Outstanding Balance
$64,167
Interest Rate
4.5%
Mortgage Type
Purchase Money Mortgage
Estimated Equity
$175,061
Purchase Details
Closed on
Feb 2, 2018
Sold by
Conteras Jesus
Bought by
Hampel Scott
Purchase Details
Closed on
Oct 15, 2010
Sold by
Hampel Scott
Bought by
Conteras Jesus
Home Financials for this Owner
Home Financials are based on the most recent Mortgage that was taken out on this home.
Original Mortgage
$76,500
Interest Rate
4.23%
Mortgage Type
Seller Take Back
Purchase Details
Closed on
Aug 17, 2010
Sold by
Whitfill Paul
Bought by
Hampel Scott
Home Financials for this Owner
Home Financials are based on the most recent Mortgage that was taken out on this home.
Original Mortgage
$76,500
Interest Rate
4.23%
Mortgage Type
Seller Take Back
Create a Home Valuation Report for This Property
The Home Valuation Report is an in-depth analysis detailing your home's value as well as a comparison with similar homes in the area
Home Values in the Area
Average Home Value in this Area
Purchase History
| Date | Buyer | Sale Price | Title Company |
|---|---|---|---|
| Updegraff Travis L | -- | Micro Title Navarro County L | |
| Hampel Scott | $76,500 | None Available | |
| Conteras Jesus | -- | -- | |
| Hampel Scott | -- | -- |
Source: Public Records
Mortgage History
| Date | Status | Borrower | Loan Amount |
|---|---|---|---|
| Open | Updegraff Travis L | $107,000 | |
| Previous Owner | Conteras Jesus | $76,500 |
Source: Public Records
Tax History Compared to Growth
Tax History
| Year | Tax Paid | Tax Assessment Tax Assessment Total Assessment is a certain percentage of the fair market value that is determined by local assessors to be the total taxable value of land and additions on the property. | Land | Improvement |
|---|---|---|---|---|
| 2025 | $3,248 | $171,549 | $28,690 | $171,230 |
| 2024 | $2,953 | $155,954 | $38,250 | $204,740 |
| 2023 | $2,271 | $141,776 | $38,250 | $204,260 |
| 2022 | $2,984 | $134,430 | $15,940 | $118,490 |
| 2021 | $3,046 | $117,170 | $15,940 | $101,230 |
| 2020 | $3,084 | $116,210 | $15,940 | $100,270 |
| 2019 | $3,121 | $113,660 | $15,940 | $97,720 |
| 2018 | $1,906 | $74,350 | $12,750 | $61,600 |
| 2017 | $1,731 | $68,120 | $12,750 | $55,370 |
| 2016 | $1,573 | $100,860 | $12,750 | $88,110 |
| 2015 | -- | $79,930 | $12,750 | $67,180 |
| 2014 | -- | $79,930 | $12,750 | $67,180 |
Source: Public Records
Map
Nearby Homes
- 524 Lakewood Ave
- 3100 Louis Ave
- 3128 Emhouse Rd
- 2809 Lafayette St
- 3704 Northpark Dr
- 2812 Winfield Dr
- 421 Forrest Ln
- TBD Emhouse
- 542 Forrest Ln
- 2604 Forest Lane Cir
- 2631 Fish Tank Rd
- 408 Fairmont Ave
- 2629 Fish Tank Rd
- 400 Fairmont Ave
- 405 Fairmont Ave
- 3700 NW County Road 0016
- 1305 Tammy Ave
- 2903 N Beaton St
- 3820 Skylane Ave
- 3816 Skylane Ave
- 3209 Louis Ave
- 3205 Louis Ave
- 3212 Louis Ave
- 3208 Louis Ave
- 608 Oakridge Cir
- 612 Oakridge Cir
- 3201 Louis Ave
- 3204 Louis Ave
- 3200 Louis Ave
- 604 Oakridge Cir
- 616 Oakridge Cir
- 3121 Louis Ave
- 3208 Oakridge Dr
- 3212 Oakridge Dr
- 3220 Oakridge Dr
- 3216 Oakridge Dr
- 615 Oakridge Cir
- 600 Oakridge Cir
- 3117 Louis Ave
- 3120 Louis Ave