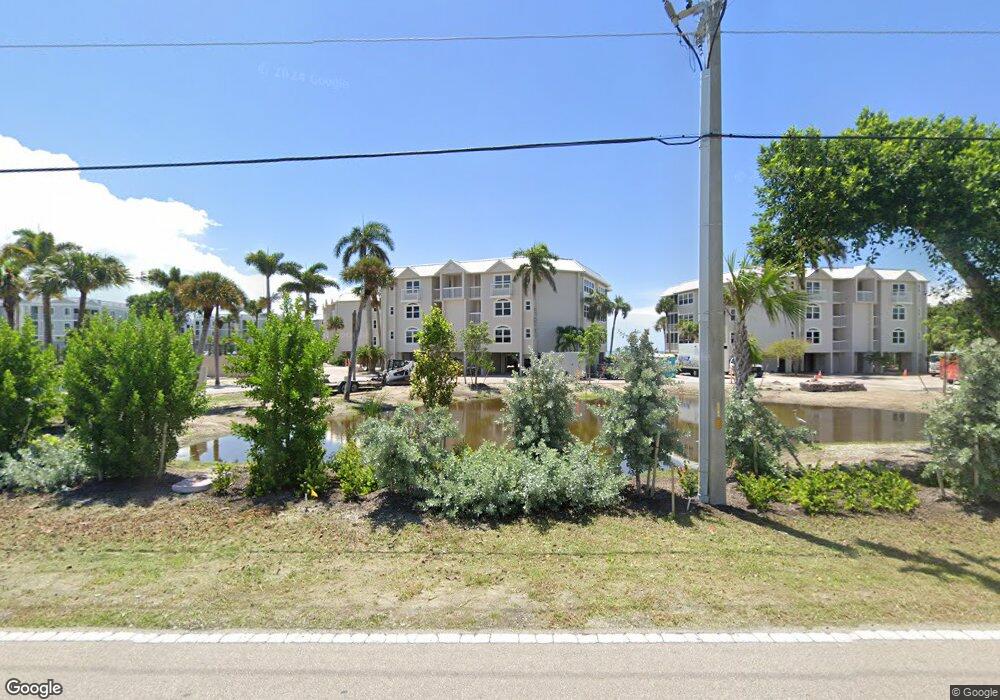
3215 W Gulf Dr Unit C202 Sanibel, FL 33957
Estimated Value: $620,000 - $1,641,000
3
Beds
3
Baths
2,345
Sq Ft
$533/Sq Ft
Est. Value
About This Home
This home is located at 3215 W Gulf Dr Unit C202, Sanibel, FL 33957 and is currently estimated at $1,249,655, approximately $532 per square foot. 3215 W Gulf Dr Unit C202 is a home located in Lee County with nearby schools including Sanibel Elementary School, Cypress Lake Middle School, and Cypress Lake High School.
Ownership History
Date
Name
Owned For
Owner Type
Purchase Details
Closed on
Dec 11, 2008
Sold by
Fenichell Peter C and Fenichell Christopher B
Bought by
Declaration Mccall Margaret M and Margaret M Mccall Declaration Of Trust
Current Estimated Value
Home Financials for this Owner
Home Financials are based on the most recent Mortgage that was taken out on this home.
Original Mortgage
$417,000
Outstanding Balance
$278,876
Interest Rate
6.38%
Mortgage Type
Unknown
Estimated Equity
$970,779
Purchase Details
Closed on
May 8, 2006
Sold by
Fenichell Patricia C
Bought by
Fenichell Patricia C and Patricia C Fenichell Trust Agreement
Purchase Details
Closed on
Apr 15, 1997
Sold by
Cannon Jeanne E
Bought by
Fenichell Melvin M and Fenichell Patricia C
Purchase Details
Closed on
Apr 14, 1997
Sold by
Cannon Miles C and Cannon Jeanne E
Bought by
Cannon Jeanne E
Create a Home Valuation Report for This Property
The Home Valuation Report is an in-depth analysis detailing your home's value as well as a comparison with similar homes in the area
Home Values in the Area
Average Home Value in this Area
Purchase History
| Date | Buyer | Sale Price | Title Company |
|---|---|---|---|
| Declaration Mccall Margaret M | $1,100,000 | Barrier Island Title Service | |
| Fenichell Patricia C | -- | Attorney | |
| Fenichell Melvin M | $622,500 | -- | |
| Cannon Jeanne E | -- | -- |
Source: Public Records
Mortgage History
| Date | Status | Borrower | Loan Amount |
|---|---|---|---|
| Open | Declaration Mccall Margaret M | $417,000 |
Source: Public Records
Tax History Compared to Growth
Tax History
| Year | Tax Paid | Tax Assessment Tax Assessment Total Assessment is a certain percentage of the fair market value that is determined by local assessors to be the total taxable value of land and additions on the property. | Land | Improvement |
|---|---|---|---|---|
| 2025 | $3,872 | $272,405 | -- | $272,405 |
| 2024 | $5,529 | $272,405 | -- | $272,405 |
| 2023 | $5,529 | $383,485 | $0 | $383,485 |
| 2022 | $22,243 | $1,628,838 | $0 | $1,628,838 |
| 2021 | $21,420 | $1,505,227 | $0 | $1,505,227 |
| 2020 | $22,424 | $1,567,358 | $0 | $1,567,358 |
| 2019 | $21,064 | $1,508,410 | $0 | $1,508,410 |
| 2018 | $20,461 | $1,510,025 | $0 | $1,510,025 |
| 2017 | $20,548 | $1,594,813 | $0 | $1,594,813 |
| 2016 | $19,275 | $1,475,623 | $0 | $1,475,623 |
| 2015 | $18,279 | $1,373,400 | $0 | $1,373,400 |
| 2014 | -- | $1,064,700 | $0 | $1,064,700 |
| 2013 | -- | $817,900 | $0 | $817,900 |
Source: Public Records
Map
Nearby Homes
- 3225 W Gulf Dr Unit B201
- 3145 W Gulf Dr Unit 102
- 3131 W Gulf Dr Unit 305
- 3304 Saint Kilda Rd
- 3304 Saint Kilda Rd Unit 1
- 4155, 4163, 4171 W Gulf Dr
- 4155,4163,4171 W Gulf Dr
- 446 Lake Murex Cir
- 3362 Barra Cir
- 458 Lake Murex Cir
- 3366 Barra Cir
- 327 Palm Lake Dr
- 3067 W Gulf Dr Unit 102
- 554 Lake Murex Cir
- 554 Lake Murex Cir Unit Lot 46
- 3004 Turtle Gait Ln
- 3191 Twin Lakes Ln
- 497 Lake Murex Cir
- 3131 Twin Lakes Ln
- 3015 W Gulf Dr Unit 102
- 3215 W Gulf Dr Unit 301A
- 3215 W Gulf Dr Unit D102
- 3215 W Gulf Dr Unit D302
- 3215 W Gulf Dr Unit A301
- 3215 W Gulf Dr Unit C101
- 3215 W Gulf Dr Unit E201
- 3215 W Gulf Dr Unit B201
- 3215 W Gulf Dr Unit D202
- 3215 W Gulf Dr Unit A102
- 3215 W Gulf Dr Unit C301
- 3215 W Gulf Dr Unit B301
- 3215 W Gulf Dr Unit A302
- 3215 W Gulf Dr Unit A201
- 3215 W Gulf Dr Unit C102
- 3215 W Gulf Dr Unit B101
- 3215 W Gulf Dr Unit A101
- 3215 W Gulf Dr Unit E301
- 3215 W Gulf Dr Unit E302
- 3215 W Gulf Dr Unit E202
- 3215 W Gulf Dr Unit E102