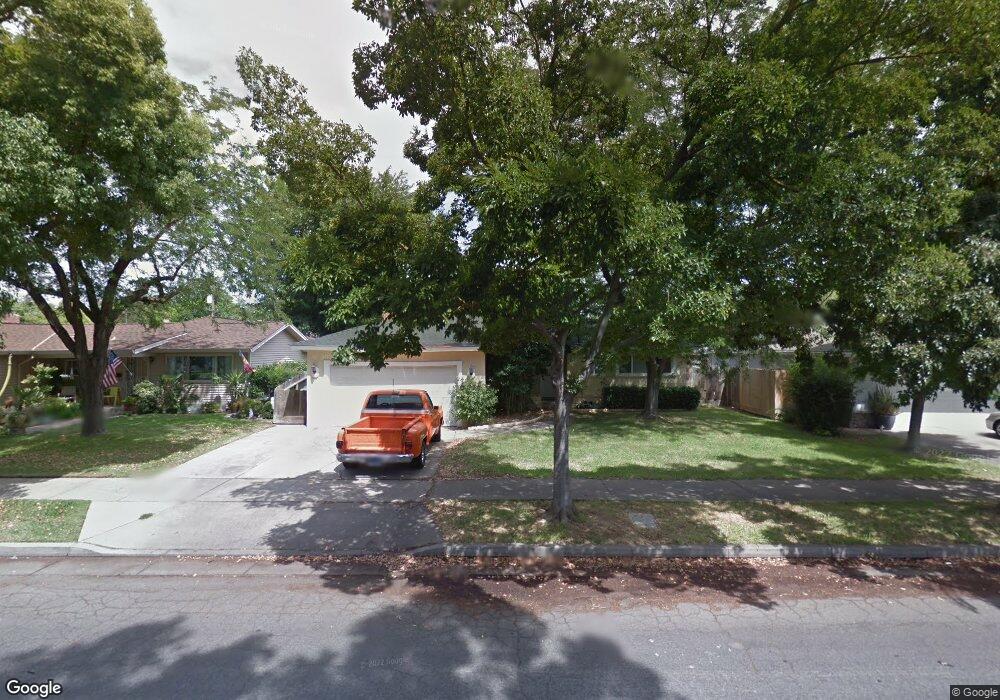
3216 Nottingham Ave Merced, CA 95340
North Merced NeighborhoodEstimated Value: $305,000 - $354,630
3
Beds
2
Baths
1,253
Sq Ft
$266/Sq Ft
Est. Value
About This Home
This home is located at 3216 Nottingham Ave, Merced, CA 95340 and is currently estimated at $333,408, approximately $266 per square foot. 3216 Nottingham Ave is a home located in Merced County with nearby schools including Donn B. Chenoweth Elementary School, Herbert H. Cruickshank Middle School, and Merced High School.
Ownership History
Date
Name
Owned For
Owner Type
Purchase Details
Closed on
Jan 16, 2014
Sold by
Lafleur Daniel La
Bought by
Lafleur Daniel R
Current Estimated Value
Purchase Details
Closed on
Aug 22, 2008
Sold by
U S Bank Na
Bought by
Lafleur Daniel
Purchase Details
Closed on
Jun 20, 2008
Sold by
Overholtzer Paula J
Bought by
U S Bank Na
Purchase Details
Closed on
Aug 2, 2005
Sold by
Overholtzer Paula J and Overholtzer John
Bought by
Overholtzer Paula J
Home Financials for this Owner
Home Financials are based on the most recent Mortgage that was taken out on this home.
Original Mortgage
$204,000
Interest Rate
6.25%
Mortgage Type
Purchase Money Mortgage
Purchase Details
Closed on
Jun 13, 2001
Sold by
Williams Deborah L
Bought by
Overholtzer Paula J
Home Financials for this Owner
Home Financials are based on the most recent Mortgage that was taken out on this home.
Original Mortgage
$116,400
Interest Rate
7.14%
Mortgage Type
Purchase Money Mortgage
Create a Home Valuation Report for This Property
The Home Valuation Report is an in-depth analysis detailing your home's value as well as a comparison with similar homes in the area
Home Values in the Area
Average Home Value in this Area
Purchase History
| Date | Buyer | Sale Price | Title Company |
|---|---|---|---|
| Lafleur Daniel R | -- | None Available | |
| Lafleur Daniel | $95,500 | Landamerica Commonwealth | |
| U S Bank Na | $105,300 | None Available | |
| Overholtzer Paula J | -- | Chicago Title Company | |
| Overholtzer Paula J | $120,000 | Chicago Title Co |
Source: Public Records
Mortgage History
| Date | Status | Borrower | Loan Amount |
|---|---|---|---|
| Previous Owner | Overholtzer Paula J | $204,000 | |
| Previous Owner | Overholtzer Paula J | $116,400 |
Source: Public Records
Tax History Compared to Growth
Tax History
| Year | Tax Paid | Tax Assessment Tax Assessment Total Assessment is a certain percentage of the fair market value that is determined by local assessors to be the total taxable value of land and additions on the property. | Land | Improvement |
|---|---|---|---|---|
| 2025 | $1,302 | $122,964 | $64,380 | $58,584 |
| 2024 | $1,302 | $120,554 | $63,118 | $57,436 |
| 2023 | $1,284 | $118,191 | $61,881 | $56,310 |
| 2022 | $1,266 | $115,874 | $60,668 | $55,206 |
| 2021 | $1,263 | $113,603 | $59,479 | $54,124 |
| 2020 | $1,272 | $112,440 | $58,870 | $53,570 |
| 2019 | $1,253 | $110,236 | $57,716 | $52,520 |
| 2018 | $1,142 | $108,076 | $56,585 | $51,491 |
| 2017 | $1,186 | $105,958 | $55,476 | $50,482 |
| 2016 | $1,167 | $103,882 | $54,389 | $49,493 |
| 2015 | $1,149 | $102,323 | $53,573 | $48,750 |
| 2014 | $1,124 | $100,320 | $52,524 | $47,796 |
Source: Public Records
Map
Nearby Homes
- 3221 Dublin Ave
- 3110 Vickie Ct
- 1226 Brookdale Dr
- 3067 Aspen St
- 3072 Ironwood Ct
- 3320 Banbury Ln
- 1073 El Portal Dr
- 1485 Hansen Ave
- 3391 Locksley Ct
- 1240 E Alexander Ave
- 3320 Cherokee Ave
- 2993 Birmingham Ct
- 3474 Cascade Creek Ave
- 2988 Bedford Dr
- 1958 Fall Brook Ct
- 822 Seneca St
- 2291 Dayna Way
- 2257 E Olive Ave
- 635 Brookdale Dr
- 2982 Sequoia Dr
- 3224 Nottingham Ave
- 3208 Nottingham Ave
- 3219 Shannon Ave
- 3232 Nottingham Ave
- 3200 Nottingham Ave
- 3227 Shannon Ave
- 3213 Shannon Ave
- 3235 Shannon Ave
- 3205 Shannon Ave
- 3219 Nottingham Ave
- 3240 Nottingham Ave
- 3192 Nottingham Ave
- 3227 Nottingham Ave
- 3205 Nottingham Ave
- 3243 Shannon Ave
- 3203 Shannon Ave
- 3235 Nottingham Ave
- 3248 Nottingham Ave
- 3195 Nottingham Ave
- 3184 Nottingham Ave