322 Daniel Dr North Tonawanda, NY 14120
Estimated Value: $363,000 - $466,000
3
Beds
3
Baths
2,146
Sq Ft
$197/Sq Ft
Est. Value
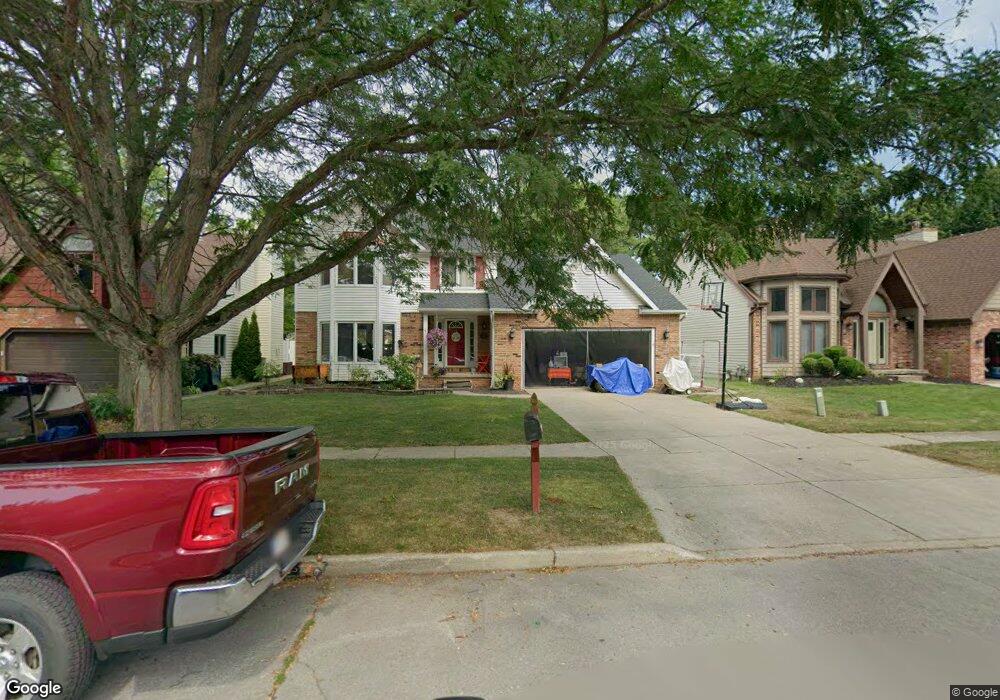
About This Home
This home is located at 322 Daniel Dr, North Tonawanda, NY 14120 and is currently estimated at $422,000, approximately $196 per square foot. 322 Daniel Dr is a home located in Niagara County with nearby schools including Drake School, St Matthew Lutheran School, and St. John Lutheran School.
Ownership History
Date
Name
Owned For
Owner Type
Purchase Details
Closed on
Aug 27, 2008
Sold by
Getz Robert
Bought by
Moore Joseph Samuel
Current Estimated Value
Home Financials for this Owner
Home Financials are based on the most recent Mortgage that was taken out on this home.
Original Mortgage
$174,080
Outstanding Balance
$115,171
Interest Rate
6.58%
Mortgage Type
VA
Estimated Equity
$306,829
Purchase Details
Closed on
Nov 12, 1998
Sold by
Miller Robert P and Miller Janice M
Bought by
Robert Ii Getz and Robert Helen
Purchase Details
Closed on
Apr 30, 1997
Sold by
Perri Jopseh Patricia M
Bought by
Miller Rboert P and Miller Janice M
Create a Home Valuation Report for This Property
The Home Valuation Report is an in-depth analysis detailing your home's value as well as a comparison with similar homes in the area
Home Values in the Area
Average Home Value in this Area
Purchase History
| Date | Buyer | Sale Price | Title Company |
|---|---|---|---|
| Moore Joseph Samuel | $170,000 | Mark Saltarelli | |
| Robert Ii Getz | $138,900 | -- | |
| Miller Rboert P | $138,900 | -- |
Source: Public Records
Mortgage History
| Date | Status | Borrower | Loan Amount |
|---|---|---|---|
| Open | Moore Joseph Samuel | $174,080 |
Source: Public Records
Tax History Compared to Growth
Tax History
| Year | Tax Paid | Tax Assessment Tax Assessment Total Assessment is a certain percentage of the fair market value that is determined by local assessors to be the total taxable value of land and additions on the property. | Land | Improvement |
|---|---|---|---|---|
| 2024 | $5,835 | $170,000 | $40,100 | $129,900 |
| 2023 | $5,686 | $170,000 | $40,100 | $129,900 |
| 2022 | $4,980 | $170,000 | $40,100 | $129,900 |
| 2021 | $4,910 | $170,000 | $40,100 | $129,900 |
| 2020 | $4,720 | $170,000 | $40,100 | $129,900 |
| 2019 | $1,988 | $170,000 | $40,100 | $129,900 |
| 2018 | $4,620 | $170,000 | $40,100 | $129,900 |
| 2017 | $4,505 | $170,000 | $40,100 | $129,900 |
| 2016 | $4,374 | $170,000 | $40,100 | $129,900 |
| 2015 | -- | $170,000 | $40,100 | $129,900 |
| 2014 | -- | $170,000 | $40,100 | $129,900 |
Source: Public Records
Map
Nearby Homes