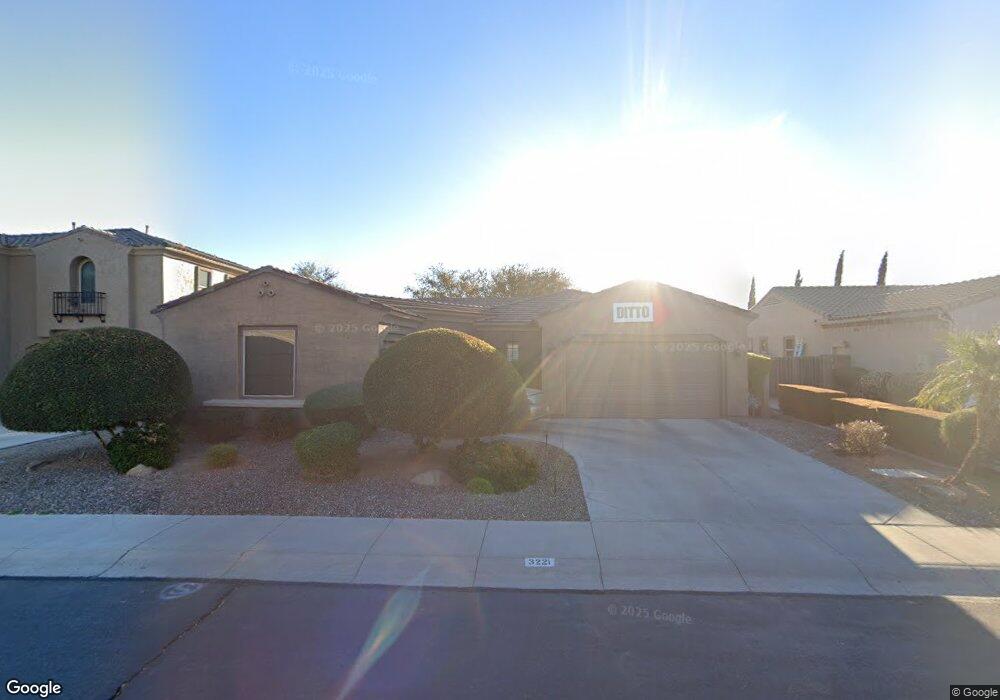
3221 S Kimberlee Way Chandler, AZ 85286
South Chandler NeighborhoodEstimated Value: $825,934 - $901,000
5
Beds
4
Baths
3,864
Sq Ft
$220/Sq Ft
Est. Value
About This Home
This home is located at 3221 S Kimberlee Way, Chandler, AZ 85286 and is currently estimated at $849,484, approximately $219 per square foot. 3221 S Kimberlee Way is a home located in Maricopa County with nearby schools including Audrey & Robert Ryan Elementary School, Santan Junior High School, and Legacy Traditional School - Chandler.
Ownership History
Date
Name
Owned For
Owner Type
Purchase Details
Closed on
Dec 8, 2014
Sold by
White Charles D
Bought by
White Charles D and Charles D White & Janet L White Family R
Current Estimated Value
Purchase Details
Closed on
Jan 9, 2006
Sold by
White Tiffany
Bought by
White Mark D
Purchase Details
Closed on
Oct 10, 2005
Sold by
Sun West Valley Developers Inc
Bought by
Sunwest Communities Inc
Purchase Details
Closed on
Nov 30, 2004
Sold by
Sunwest Communities Inc
Bought by
White Mark D and White Charles D
Home Financials for this Owner
Home Financials are based on the most recent Mortgage that was taken out on this home.
Original Mortgage
$135,000
Interest Rate
6.18%
Mortgage Type
New Conventional
Create a Home Valuation Report for This Property
The Home Valuation Report is an in-depth analysis detailing your home's value as well as a comparison with similar homes in the area
Home Values in the Area
Average Home Value in this Area
Purchase History
| Date | Buyer | Sale Price | Title Company |
|---|---|---|---|
| White Charles D | -- | None Available | |
| White Charles D | -- | None Available | |
| White Mark D | -- | First American Title Ins Co | |
| White Charles D | -- | First American Title Ins Co | |
| Sunwest Communities Inc | -- | First American Title Ins Co | |
| Sun West Valley Developers Inc | -- | First American Title Ins Co | |
| White Mark D | $461,502 | First American Title Ins Co |
Source: Public Records
Mortgage History
| Date | Status | Borrower | Loan Amount |
|---|---|---|---|
| Previous Owner | White Mark D | $135,000 |
Source: Public Records
Tax History Compared to Growth
Tax History
| Year | Tax Paid | Tax Assessment Tax Assessment Total Assessment is a certain percentage of the fair market value that is determined by local assessors to be the total taxable value of land and additions on the property. | Land | Improvement |
|---|---|---|---|---|
| 2025 | $4,044 | $49,236 | -- | -- |
| 2024 | $3,883 | $46,891 | -- | -- |
| 2023 | $3,883 | $64,370 | $12,870 | $51,500 |
| 2022 | $3,743 | $48,870 | $9,770 | $39,100 |
| 2021 | $3,856 | $46,200 | $9,240 | $36,960 |
| 2020 | $3,830 | $42,870 | $8,570 | $34,300 |
| 2019 | $3,676 | $40,010 | $8,000 | $32,010 |
| 2018 | $3,552 | $38,280 | $7,650 | $30,630 |
| 2017 | $3,303 | $37,610 | $7,520 | $30,090 |
| 2016 | $3,170 | $38,210 | $7,640 | $30,570 |
| 2015 | $3,046 | $35,680 | $7,130 | $28,550 |
Source: Public Records
Map
Nearby Homes
- 2576 E Dogwood Dr
- 2541 E Wisteria Dr
- 2571 E Balsam Ct
- 3371 S Roger Ct
- 3380 S Roger Ct
- 3330 S Gilbert Rd Unit 1072
- 3330 S Gilbert Rd Unit 2062
- 3330 S Gilbert Rd Unit 2066
- 3330 S Gilbert Rd Unit 2018
- 3330 S Gilbert Rd Unit 2032
- 3330 S Gilbert Rd Unit 1003
- 3330 S Gilbert Rd Unit 1075
- 3330 S Gilbert Rd Unit 1024
- 3330 S Gilbert Rd Unit 2001
- 3330 S Gilbert Rd Unit 2013
- 2960 E Sunrise Place
- 2198 E Wisteria Dr
- 3273 E Lantana Place
- 3031 S Valerie Dr
- 2489 E Sequoia Dr
- 3211 S Kimberlee Way
- 3231 S Kimberlee Way
- 2636 E Dogwood Dr
- 3201 S Kimberlee Way
- 3222 S Kimberlee Way
- 3232 S Kimberlee Way
- 2646 E Dogwood Dr
- 2646 E Dogwood Dr
- 3202 S Kimberlee Way
- 2617 E Dogwood Dr
- 2627 E Dogwood Dr
- 2607 E Dogwood Dr
- 2637 E Dogwood Dr
- 3151 S Kimberlee Way
- 2605 E Honeysuckle Place
- 2596 E Dogwood Dr
- 3214 S Wilson Dr
- 3224 S Wilson Dr
- 3204 S Wilson Dr
- 2647 E Dogwood Dr