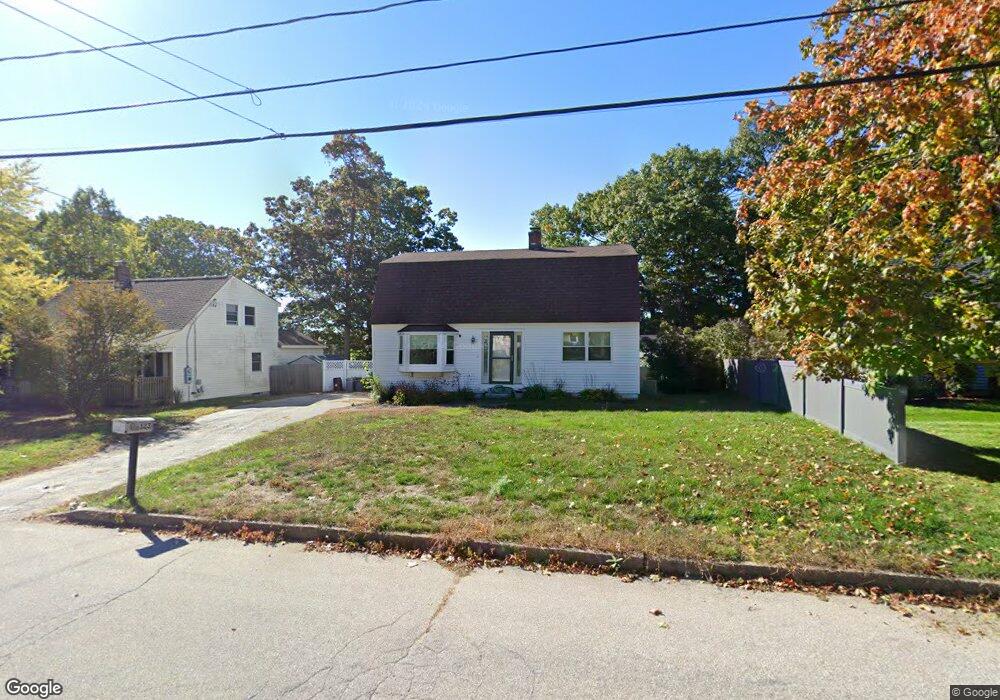
323 Hoyt St Manchester, NH 03103
Southside NeighborhoodEstimated Value: $493,000 - $506,000
3
Beds
2
Baths
1,632
Sq Ft
$305/Sq Ft
Est. Value
About This Home
This home is located at 323 Hoyt St, Manchester, NH 03103 and is currently estimated at $496,951, approximately $304 per square foot. 323 Hoyt St is a home located in Hillsborough County with nearby schools including Jewett Street Elementary School, Southside Middle School, and Manchester Memorial High School.
Ownership History
Date
Name
Owned For
Owner Type
Purchase Details
Closed on
Aug 16, 2013
Sold by
Sullivan Christopher
Bought by
Sullivan Mary
Current Estimated Value
Purchase Details
Closed on
Jul 27, 2009
Sold by
Hebert Jon M and Aguilera-Hebert Sylvia
Bought by
Sullivan Christopher and Stelmaszyk Mary
Home Financials for this Owner
Home Financials are based on the most recent Mortgage that was taken out on this home.
Original Mortgage
$201,188
Interest Rate
5.58%
Mortgage Type
Purchase Money Mortgage
Create a Home Valuation Report for This Property
The Home Valuation Report is an in-depth analysis detailing your home's value as well as a comparison with similar homes in the area
Home Values in the Area
Average Home Value in this Area
Purchase History
| Date | Buyer | Sale Price | Title Company |
|---|---|---|---|
| Sullivan Mary | -- | -- | |
| Sullivan Christopher | $204,900 | -- |
Source: Public Records
Mortgage History
| Date | Status | Borrower | Loan Amount |
|---|---|---|---|
| Open | Sullivan Christopher | $60,320 | |
| Previous Owner | Sullivan Christopher | $205,216 | |
| Previous Owner | Sullivan Christopher | $240,015 | |
| Previous Owner | Sullivan Christopher | $201,188 |
Source: Public Records
Tax History Compared to Growth
Tax History
| Year | Tax Paid | Tax Assessment Tax Assessment Total Assessment is a certain percentage of the fair market value that is determined by local assessors to be the total taxable value of land and additions on the property. | Land | Improvement |
|---|---|---|---|---|
| 2024 | $6,011 | $307,000 | $106,600 | $200,400 |
| 2023 | $5,790 | $307,000 | $106,600 | $200,400 |
| 2022 | $5,600 | $307,000 | $106,600 | $200,400 |
| 2021 | $5,428 | $307,000 | $106,600 | $200,400 |
| 2020 | $5,322 | $215,800 | $73,500 | $142,300 |
| 2019 | $5,248 | $215,800 | $73,500 | $142,300 |
| 2018 | $5,110 | $215,800 | $73,500 | $142,300 |
| 2017 | $5,032 | $215,800 | $73,500 | $142,300 |
| 2016 | $4,994 | $215,800 | $73,500 | $142,300 |
| 2015 | $4,796 | $204,600 | $68,100 | $136,500 |
| 2014 | $4,808 | $204,600 | $68,100 | $136,500 |
| 2013 | $4,638 | $204,600 | $68,100 | $136,500 |
Source: Public Records
Map
Nearby Homes