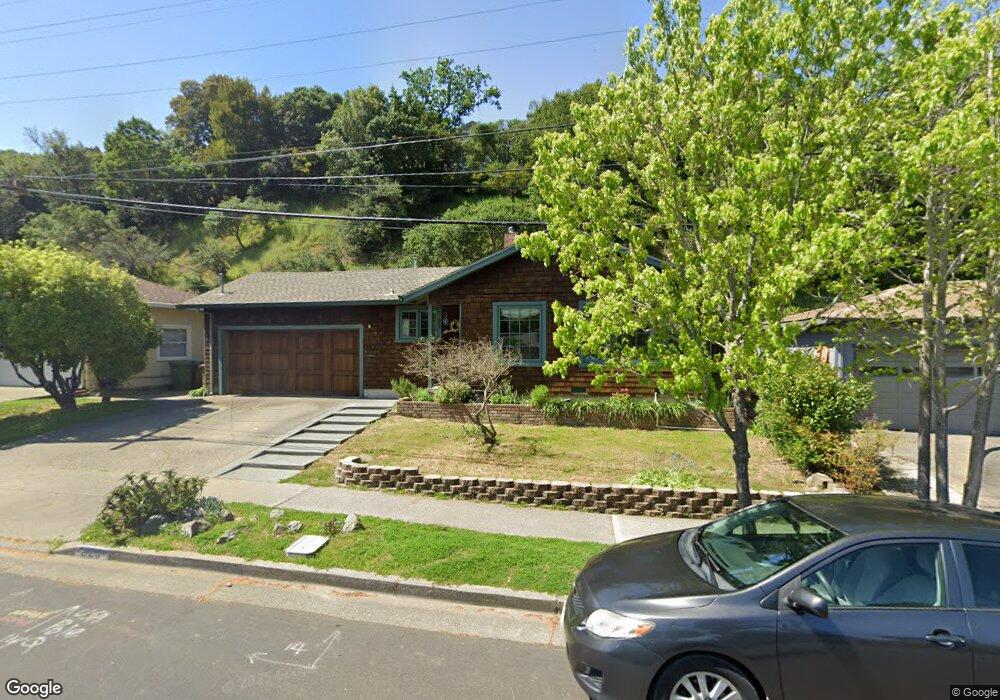
323 Irwin St San Rafael, CA 94901
Picnic Valley NeighborhoodEstimated Value: $1,092,000 - $1,199,000
3
Beds
2
Baths
1,400
Sq Ft
$808/Sq Ft
Est. Value
About This Home
This home is located at 323 Irwin St, San Rafael, CA 94901 and is currently estimated at $1,131,098, approximately $807 per square foot. 323 Irwin St is a home located in Marin County with nearby schools including Laurel Dell Elementary School, Coleman Elementary School, and James B. Davidson Middle School.
Ownership History
Date
Name
Owned For
Owner Type
Purchase Details
Closed on
Sep 15, 2016
Sold by
Gaffney Sarsvati A
Bought by
Baccigaluppi John and Baccigaluppi Maria L
Current Estimated Value
Home Financials for this Owner
Home Financials are based on the most recent Mortgage that was taken out on this home.
Original Mortgage
$257,914
Outstanding Balance
$206,012
Interest Rate
3.43%
Mortgage Type
Credit Line Revolving
Estimated Equity
$925,086
Purchase Details
Closed on
Feb 16, 2012
Sold by
Gaffney Ian
Bought by
Gaffney Sarasvati A
Home Financials for this Owner
Home Financials are based on the most recent Mortgage that was taken out on this home.
Original Mortgage
$416,579
Interest Rate
3.83%
Mortgage Type
New Conventional
Purchase Details
Closed on
Jun 18, 2001
Sold by
Rosenbaum Stephen H and Rosenbaum Marion Bulin
Bought by
Meyer Sarasvati A
Home Financials for this Owner
Home Financials are based on the most recent Mortgage that was taken out on this home.
Original Mortgage
$360,000
Interest Rate
7.62%
Create a Home Valuation Report for This Property
The Home Valuation Report is an in-depth analysis detailing your home's value as well as a comparison with similar homes in the area
Home Values in the Area
Average Home Value in this Area
Purchase History
| Date | Buyer | Sale Price | Title Company |
|---|---|---|---|
| Baccigaluppi John | $860,000 | Fidelity National Title Co | |
| Gaffney Sarasvati A | -- | Old Republic Title Company | |
| Gaffney Sarasvati A | -- | Old Republic Title Company | |
| Meyer Sarasvati A | $450,000 | California Land Title Co |
Source: Public Records
Mortgage History
| Date | Status | Borrower | Loan Amount |
|---|---|---|---|
| Open | Baccigaluppi John | $257,914 | |
| Open | Baccigaluppi John | $516,000 | |
| Previous Owner | Gaffney Sarasvati A | $416,579 | |
| Previous Owner | Meyer Sarasvati A | $360,000 |
Source: Public Records
Tax History Compared to Growth
Tax History
| Year | Tax Paid | Tax Assessment Tax Assessment Total Assessment is a certain percentage of the fair market value that is determined by local assessors to be the total taxable value of land and additions on the property. | Land | Improvement |
|---|---|---|---|---|
| 2025 | $13,822 | $996,921 | $609,294 | $387,627 |
| 2024 | $13,822 | $977,378 | $597,350 | $380,028 |
| 2023 | $13,585 | $958,214 | $585,637 | $372,577 |
| 2022 | $12,841 | $939,427 | $574,155 | $365,272 |
| 2021 | $12,638 | $921,010 | $562,899 | $358,111 |
| 2020 | $12,512 | $911,570 | $557,130 | $354,440 |
| 2019 | $12,134 | $893,703 | $546,210 | $347,493 |
| 2018 | $12,014 | $876,180 | $535,500 | $340,680 |
| 2017 | $11,557 | $859,000 | $525,000 | $334,000 |
| 2016 | $7,873 | $561,549 | $390,010 | $171,539 |
| 2015 | $7,525 | $553,116 | $384,153 | $168,963 |
| 2014 | $7,205 | $542,285 | $376,630 | $165,655 |
Source: Public Records
Map
Nearby Homes
- 4 Meadow Ave
- 10 Hazel Ct
- 142 Bungalow Ave
- 150 Bungalow Ave
- 148 Auburn St
- 321 N Almenar Dr
- 296 N Almenar Dr
- 215 Picnic Ave
- 19 Mliss Ln
- 490 Canal St Unit 6
- 2 Alvina Ave
- 124 Tiburon Blvd
- 370 Via la Cumbre
- 236 C St
- 81 Corte Gracitas
- 56 Mooring Rd Unit 2
- 4 Point San Pedro Rd Unit 4
- 207 D St
- 105 Bayview St
- 523 B St