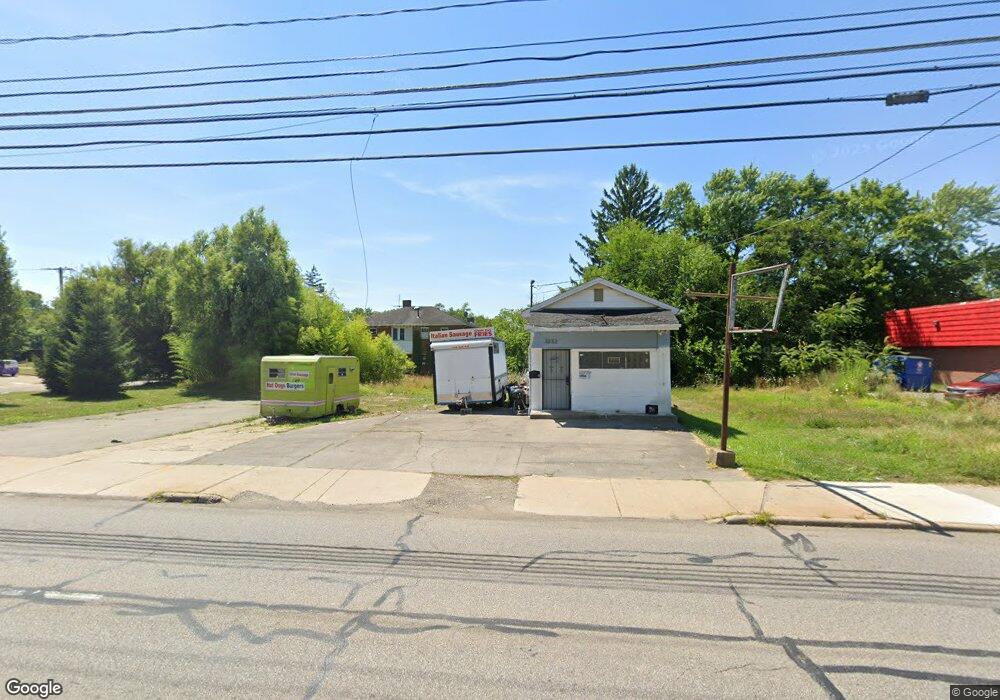
3232 South Ave Youngstown, OH 44502
Cottage Grove NeighborhoodEstimated Value: $40,475
--
Bed
--
Bath
600
Sq Ft
$67/Sq Ft
Est. Value
About This Home
This home is located at 3232 South Ave, Youngstown, OH 44502 and is currently estimated at $40,475, approximately $67 per square foot. 3232 South Ave is a home located in Mahoning County with nearby schools including Taft Elementary School, East High School, and Horizon Science Academy - Youngstown.
Ownership History
Date
Name
Owned For
Owner Type
Purchase Details
Closed on
Aug 8, 2022
Bought by
Frazier Land Co Llc
Current Estimated Value
Purchase Details
Closed on
Aug 4, 2022
Sold by
Clinkscale Sylvia
Bought by
Frazier Land Co Llc
Purchase Details
Closed on
Jul 26, 2022
Bought by
Clinkscale Sylvia
Purchase Details
Closed on
Jul 25, 2022
Sold by
Clinkscale Arthur
Bought by
Clinkscale Sylvia
Purchase Details
Closed on
Aug 10, 2016
Sold by
Jackson James
Bought by
Clinkscale Arthur
Purchase Details
Closed on
Nov 14, 2013
Sold by
Seals Roberta and Seals James L
Bought by
Jackson James L
Purchase Details
Closed on
Apr 27, 2009
Sold by
Brams Beverage Inc
Bought by
Seals Roberta and Seals James O
Purchase Details
Closed on
Oct 4, 1999
Sold by
Bialik Athena D
Bought by
Moffie Samuel M
Purchase Details
Closed on
Apr 15, 1994
Bought by
Bialik Jos and Bialik Athena
Create a Home Valuation Report for This Property
The Home Valuation Report is an in-depth analysis detailing your home's value as well as a comparison with similar homes in the area
Home Values in the Area
Average Home Value in this Area
Purchase History
| Date | Buyer | Sale Price | Title Company |
|---|---|---|---|
| Frazier Land Co Llc | $33,000 | -- | |
| Frazier Land Co Llc | $33,000 | None Listed On Document | |
| Clinkscale Sylvia | -- | -- | |
| Clinkscale Sylvia | -- | None Listed On Document | |
| Clinkscale Arthur | -- | None Available | |
| Jackson James L | -- | None Available | |
| Seals Roberta | $4,800 | Attorney | |
| Moffie Samuel M | $13,000 | -- | |
| Bialik Jos | $20,000 | -- |
Source: Public Records
Tax History Compared to Growth
Tax History
| Year | Tax Paid | Tax Assessment Tax Assessment Total Assessment is a certain percentage of the fair market value that is determined by local assessors to be the total taxable value of land and additions on the property. | Land | Improvement |
|---|---|---|---|---|
| 2024 | $736 | $10,220 | $2,180 | $8,040 |
| 2023 | $737 | $10,220 | $2,180 | $8,040 |
| 2022 | $346 | $4,290 | $2,180 | $2,110 |
| 2021 | $346 | $4,290 | $2,180 | $2,110 |
| 2020 | $349 | $4,290 | $2,180 | $2,110 |
| 2019 | $360 | $4,290 | $2,180 | $2,110 |
| 2018 | $419 | $4,290 | $2,180 | $2,110 |
| 2017 | $315 | $4,290 | $2,180 | $2,110 |
| 2016 | $270 | $3,290 | $1,460 | $1,830 |
| 2015 | $278 | $3,290 | $1,460 | $1,830 |
| 2014 | $262 | $3,290 | $1,460 | $1,830 |
| 2013 | $258 | $3,290 | $1,460 | $1,830 |
Source: Public Records
Map
Nearby Homes
- 358 E Auburndale Ave
- 524 E Philadelphia Ave
- 537 Cambridge Ave
- 582 Roxbury Ave
- 2740 South Ave
- 805 E Boston Ave
- 371 Potomac Ave
- 207 E Lucius Ave
- 3726 Sunset Blvd
- 182 E Auburndale Ave
- 703 E Judson Ave
- 857 E Boston Ave
- 144 Brooklyn Ave
- 808 Marmion Ave
- 123 E Boston Ave
- 161 E Auburndale Ave
- 365 E Midlothian Blvd
- 102 E Boston Ave
- 159 E Ravenwood Ave
- 564 Miller St
- 3228 South Ave
- 376 E Lucius Ave Unit 378
- 3240 South Ave
- 3216 South Ave
- 374 E Lucius Ave
- 3211 3213 South Ave
- 372 E Lucius Ave
- 373 E Avondale Ave
- 367 E Avondale Ave
- 3229 South Ave
- 3213 South Ave
- 3300 South Ave
- 3211 3213 &15 South Ave Unit 3
- 366 E Lucius Ave
- 3211 South Ave Unit 3
- 3211 South Ave
- 3309 South Ave
- 363 E Avondale Ave
- 3134 South Ave
- 3136 South Ave