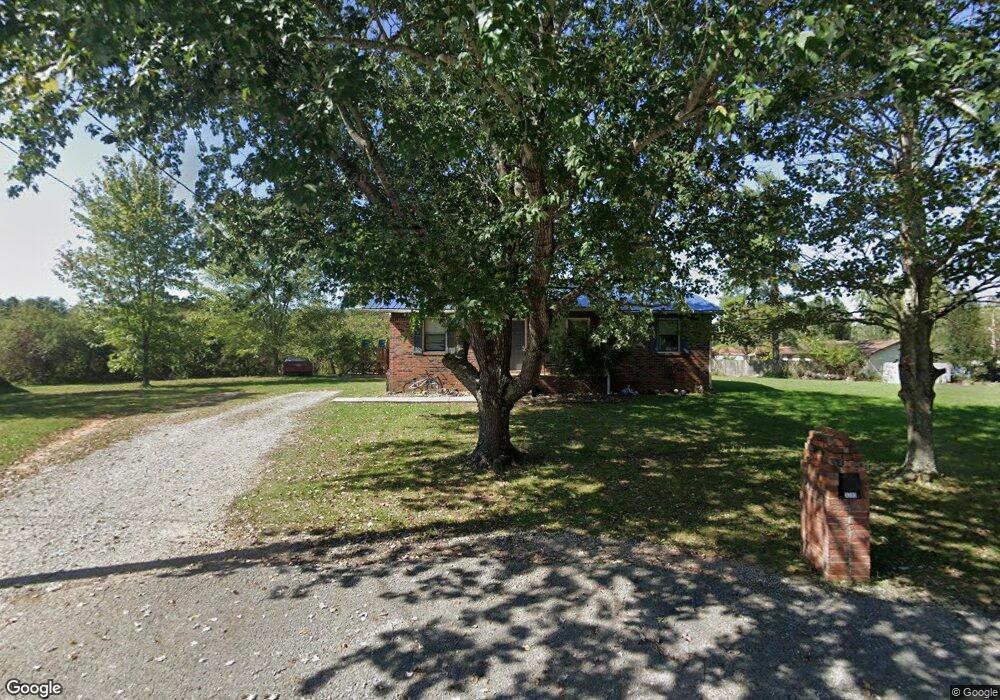
3233 Cass Ct Cookeville, TN 38501
Estimated Value: $183,667 - $225,000
--
Bed
2
Baths
1,188
Sq Ft
$174/Sq Ft
Est. Value
About This Home
This home is located at 3233 Cass Ct, Cookeville, TN 38501 and is currently estimated at $206,417, approximately $173 per square foot. 3233 Cass Ct is a home located in Putnam County with nearby schools including Cane Creek Elementary School, Upperman Middle School, and Upperman High School.
Ownership History
Date
Name
Owned For
Owner Type
Purchase Details
Closed on
Jul 3, 2008
Sold by
Angela Williams
Bought by
Angela Cherry and Angela Cherry W
Current Estimated Value
Home Financials for this Owner
Home Financials are based on the most recent Mortgage that was taken out on this home.
Original Mortgage
$76,500
Interest Rate
6.03%
Purchase Details
Closed on
Dec 14, 2000
Sold by
Harold Williams
Bought by
Angela Williams
Purchase Details
Closed on
Jun 15, 1999
Sold by
Ledbetter Shari O
Bought by
Williams Harold L and Williams Angela
Purchase Details
Closed on
Aug 19, 1994
Bought by
Ledbetter Shari O
Purchase Details
Closed on
Dec 23, 1992
Bought by
Bailey Ryan and Bailey Gina
Purchase Details
Closed on
Jun 12, 1992
Bought by
Bouton H S
Purchase Details
Closed on
Dec 12, 1988
Bought by
Myers James D and Myers Kimberlay A Myers
Purchase Details
Closed on
Jul 28, 1988
Bought by
United States Of America Fha
Purchase Details
Closed on
Jan 22, 1985
Bought by
Clayton Jimmy A and Clayton Alice J
Create a Home Valuation Report for This Property
The Home Valuation Report is an in-depth analysis detailing your home's value as well as a comparison with similar homes in the area
Home Values in the Area
Average Home Value in this Area
Purchase History
| Date | Buyer | Sale Price | Title Company |
|---|---|---|---|
| Angela Cherry | -- | -- | |
| Angela Williams | -- | -- | |
| Williams Harold L | $63,000 | -- | |
| Ledbetter Shari O | $49,900 | -- | |
| Bailey Ryan | $45,000 | -- | |
| Bouton H S | $32,500 | -- | |
| Myers James D | -- | -- | |
| United States Of America Fha | -- | -- | |
| Clayton Jimmy A | -- | -- |
Source: Public Records
Mortgage History
| Date | Status | Borrower | Loan Amount |
|---|---|---|---|
| Closed | Clayton Jimmy A | $76,500 |
Source: Public Records
Tax History Compared to Growth
Tax History
| Year | Tax Paid | Tax Assessment Tax Assessment Total Assessment is a certain percentage of the fair market value that is determined by local assessors to be the total taxable value of land and additions on the property. | Land | Improvement |
|---|---|---|---|---|
| 2024 | $747 | $28,075 | $3,500 | $24,575 |
| 2023 | $747 | $28,075 | $3,500 | $24,575 |
| 2022 | $694 | $28,075 | $3,500 | $24,575 |
| 2021 | $694 | $28,075 | $3,500 | $24,575 |
| 2020 | $642 | $28,075 | $3,500 | $24,575 |
| 2019 | $594 | $21,950 | $3,500 | $18,450 |
| 2018 | $554 | $20,300 | $3,500 | $16,800 |
| 2017 | $554 | $20,300 | $3,500 | $16,800 |
| 2016 | $554 | $20,300 | $3,500 | $16,800 |
| 2015 | $569 | $20,300 | $3,500 | $16,800 |
| 2014 | $549 | $19,585 | $0 | $0 |
Source: Public Records
Map
Nearby Homes
- 1711 Creekside Dr
- 1775 Creekside Dr
- 500 N McBroom Chapel Rd
- 2269 Plunk Whitson Rd
- 2136 W Broad St
- 1475 Dyer Creek Rd
- 2312 Benjy Cir
- 4131 Charlton Square
- 270 Locust Grove Rd
- 3815 Spurgeon Dr
- 1764 Bouton Dr
- 0 Corner of W Broad St & Tn Ave Unit RTC2794105
- 1957 W Broad St
- 279 Willow Brook Dr
- 2.52 St
- 553 County Farm Rd
- 918 Faye Dr
- 2911 Grand Ridge Dr
- Lot 3 Miller
- 1024 Grandiose Dr
- 3228 Mesa Ct
- 3232 Cass Ct
- 1048 Grandiose Dr
- 3218 Cass Ct
- 3227 Mesa Ct
- 968 Grandiose Dr
- 940 Grandiose Dr
- 1003 Grandiose Dr
- 1025 Grandiose Dr
- 989 Grandiose Dr
- 1124 Grandiose Dr
- 1047 Grandiose Dr
- 3280 Carlisle Rd
- 936 Grandiose Dr
- 973 Grandiose Dr
- 1101 Grandiose Dr
- 967 Grandiose Dr
- 3242 Carlisle Rd
- 3216 Carlisle Rd