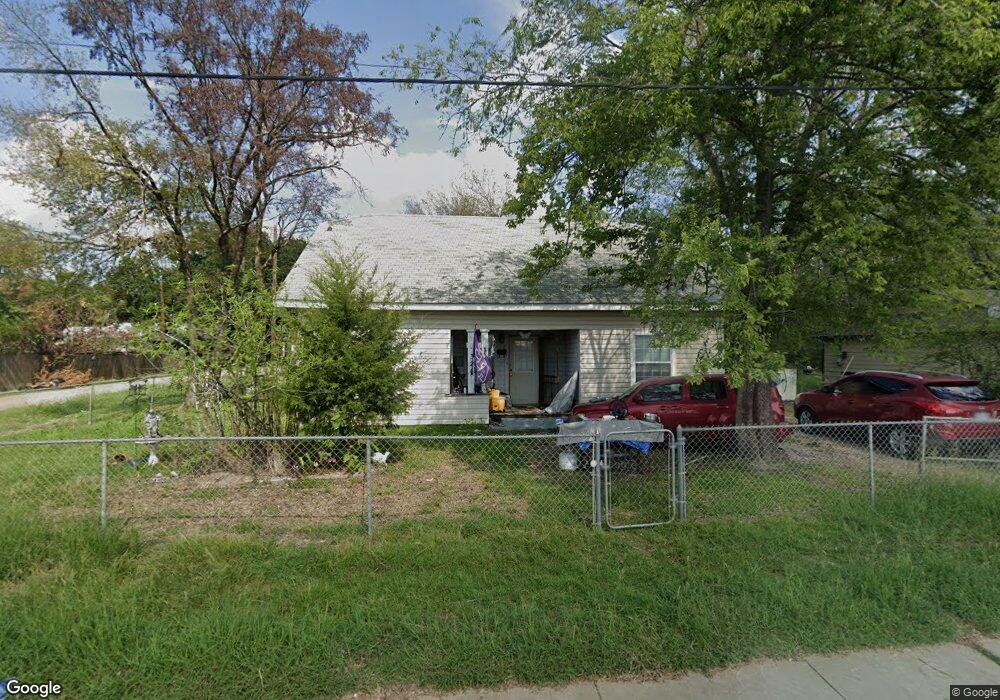
324 Abney Ave Lufkin, TX 75904
Estimated Value: $74,000 - $142,000
--
Bed
5
Baths
1,188
Sq Ft
$91/Sq Ft
Est. Value
About This Home
This home is located at 324 Abney Ave, Lufkin, TX 75904 and is currently estimated at $108,587, approximately $91 per square foot. 324 Abney Ave is a home located in Angelina County with nearby schools including Garrett Primary School, Dunbar Primary School, and Brandon Elementary School.
Ownership History
Date
Name
Owned For
Owner Type
Purchase Details
Closed on
Nov 13, 2024
Sold by
Cheshire Robert Garrison
Bought by
Cheshire Caleb
Current Estimated Value
Purchase Details
Closed on
Nov 12, 2024
Sold by
Holguin Jorge L
Bought by
Ruiz Alma Rosa Holguin and Rivera Juan Jose
Purchase Details
Closed on
Nov 6, 2024
Sold by
Greene Jack M and Greene Florence
Bought by
Greene Jack Montgomery and Greene G
Purchase Details
Closed on
Oct 16, 2024
Sold by
Gray Amber
Bought by
Johnson Brian
Purchase Details
Closed on
Apr 29, 2016
Sold by
Rodriquez Benito
Bought by
Ramirez Juanita
Purchase Details
Closed on
Jul 20, 2010
Sold by
Rodriguez Perez Alice and Rodriguez Benito
Bought by
Ramirez Jose S and Ramirez Juanita B
Purchase Details
Closed on
Feb 26, 2010
Sold by
Perez Alice Rodriguez and Rodriguez Benito
Bought by
Ramirez Jose S and Ramirez Juanita B
Create a Home Valuation Report for This Property
The Home Valuation Report is an in-depth analysis detailing your home's value as well as a comparison with similar homes in the area
Home Values in the Area
Average Home Value in this Area
Purchase History
| Date | Buyer | Sale Price | Title Company |
|---|---|---|---|
| Cheshire Caleb | -- | None Listed On Document | |
| Cheshire Caleb | -- | None Listed On Document | |
| Ruiz Alma Rosa Holguin | -- | None Listed On Document | |
| Ruiz Alma Rosa Holguin | -- | None Listed On Document | |
| Greene Jack Montgomery | -- | None Listed On Document | |
| Hunt Darian | $4,528 | None Listed On Document | |
| Greene Jack Montgomery | -- | None Listed On Document | |
| Hunt Darian | $4,528 | None Listed On Document | |
| Johnson Brian | -- | None Listed On Document | |
| Ramirez Juanita | -- | Attorney | |
| Ramirez Jose S | -- | None Available | |
| Ramirez Jose S | -- | None Available |
Source: Public Records
Tax History Compared to Growth
Tax History
| Year | Tax Paid | Tax Assessment Tax Assessment Total Assessment is a certain percentage of the fair market value that is determined by local assessors to be the total taxable value of land and additions on the property. | Land | Improvement |
|---|---|---|---|---|
| 2025 | $1,765 | $84,450 | $11,680 | $72,770 |
| 2024 | $1,730 | $82,800 | $11,680 | $71,120 |
| 2023 | $1,627 | $81,870 | $11,680 | $70,190 |
| 2022 | $1,086 | $47,680 | $4,040 | $43,640 |
| 2021 | $1,008 | $40,920 | $4,040 | $36,880 |
| 2020 | $883 | $35,930 | $3,160 | $32,770 |
| 2019 | $934 | $35,930 | $3,160 | $32,770 |
| 2018 | $790 | $34,700 | $3,160 | $31,540 |
| 2017 | $790 | $33,130 | $3,160 | $29,970 |
| 2016 | $1,017 | $42,650 | $3,160 | $39,490 |
| 2015 | $851 | $31,380 | $3,160 | $28,220 |
| 2014 | $851 | $29,230 | $3,160 | $26,070 |
Source: Public Records
Map
Nearby Homes
- 1101 N 1st St
- 902 Cain St
- 521 N 1st St
- 801 Rowe Ave
- 417 Martin Luther King jr Blvd
- 505 N 1st St
- Lt 5.2 & 6 Treadwell Ave
- 408 Bob St
- 318 Lake Alley
- 301 Culverhouse St
- 801 Oquinn Ave
- 1123 Sayers St
- 515 Martin Luther King jr Blvd
- TBD State Highway 103
- Tract 32 Walker Loop
- 223 Stoney Ridge
- 116 Pine St
- 112 Pine St
- 722 North Ave
- 420 Mantooth Ave
- 316 Abney Ave
- 402 Abney Ave
- 818 Scarbrough St
- 310 Abney Ave
- 815 Scarbrough St
- 306 Abney Ave
- 718 Sayers St
- 826 Scarbrough St
- 823 Scarbrough St
- 302 Abney Ave
- 827 Scarbrough St
- 315 Setliff St
- 319 Setliff St
- 726 Sayers St
- 500 Abney Ave
- 101 Martin Luther King jr Blvd
- 101 Martin Luther King Dr
- 200 Scarbrough St
- 322 Setliff St
- 122 W Laurel Ave