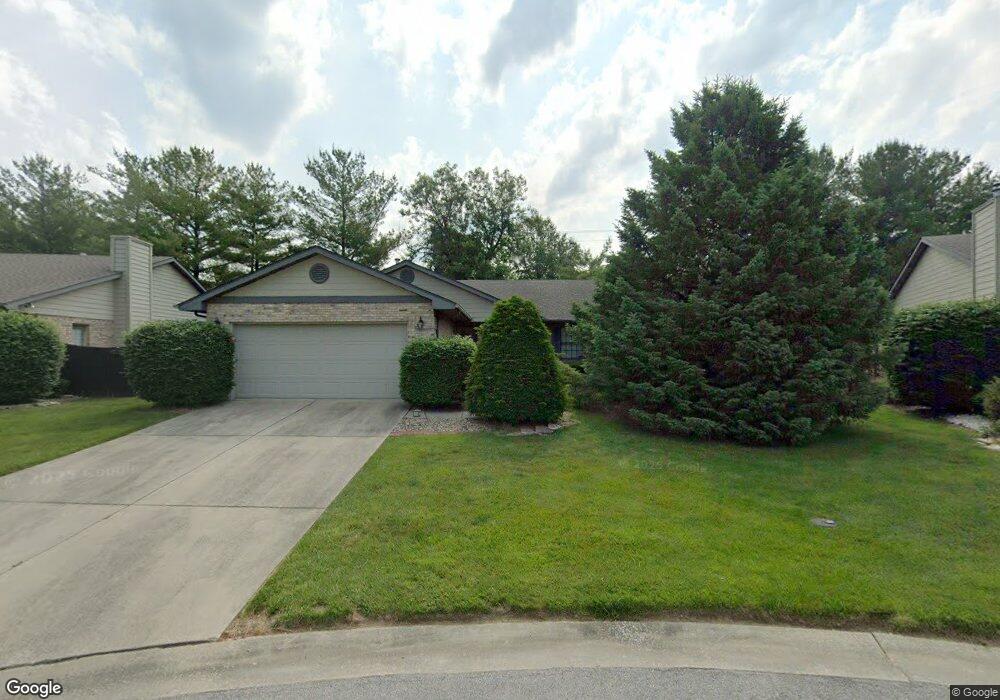
324 Hickory Bend Belleville, IL 62223
Estimated Value: $206,000 - $278,000
3
Beds
2
Baths
1,898
Sq Ft
$129/Sq Ft
Est. Value
About This Home
This home is located at 324 Hickory Bend, Belleville, IL 62223 and is currently estimated at $244,601, approximately $128 per square foot. 324 Hickory Bend is a home located in St. Clair County with nearby schools including Ellis Elementary School, Emge Junior High School, and Our Lady Queen Of Peace Catholic School.
Ownership History
Date
Name
Owned For
Owner Type
Purchase Details
Closed on
Dec 30, 2021
Sold by
Moore James E
Bought by
Thomas Gail E
Current Estimated Value
Purchase Details
Closed on
Jul 19, 2018
Sold by
Thomas Gail E
Bought by
Thomas Gail E and Moore James E
Purchase Details
Closed on
Jun 23, 2009
Sold by
Schwalb Eric and Schwalb Craig
Bought by
Thomas Ray and Thomas Charlene
Purchase Details
Closed on
May 15, 2006
Sold by
Struense Janice C
Bought by
Schwalb Margaret A
Home Financials for this Owner
Home Financials are based on the most recent Mortgage that was taken out on this home.
Original Mortgage
$60,000
Interest Rate
6.54%
Mortgage Type
Fannie Mae Freddie Mac
Purchase Details
Closed on
Jan 8, 2004
Sold by
Struense Janice C
Bought by
Struense Janice C
Create a Home Valuation Report for This Property
The Home Valuation Report is an in-depth analysis detailing your home's value as well as a comparison with similar homes in the area
Home Values in the Area
Average Home Value in this Area
Purchase History
| Date | Buyer | Sale Price | Title Company |
|---|---|---|---|
| Thomas Gail E | -- | None Available | |
| Thomas Gail E | -- | None Available | |
| Thomas Ray | $150,000 | Community Title Shiloh Llc | |
| Schwalb Margaret A | $184,000 | Fatic | |
| Struense Janice C | -- | -- |
Source: Public Records
Mortgage History
| Date | Status | Borrower | Loan Amount |
|---|---|---|---|
| Previous Owner | Schwalb Margaret A | $60,000 |
Source: Public Records
Tax History Compared to Growth
Tax History
| Year | Tax Paid | Tax Assessment Tax Assessment Total Assessment is a certain percentage of the fair market value that is determined by local assessors to be the total taxable value of land and additions on the property. | Land | Improvement |
|---|---|---|---|---|
| 2024 | $4,867 | $68,768 | $12,848 | $55,920 |
| 2023 | $4,454 | $61,703 | $11,528 | $50,175 |
| 2022 | $4,143 | $55,992 | $10,461 | $45,531 |
| 2021 | $3,924 | $51,984 | $9,712 | $42,272 |
| 2020 | $3,874 | $49,939 | $9,448 | $40,491 |
| 2019 | $3,854 | $49,939 | $9,448 | $40,491 |
| 2018 | $3,687 | $47,720 | $9,028 | $38,692 |
| 2017 | $3,395 | $44,443 | $8,408 | $36,035 |
| 2016 | $3,363 | $45,408 | $7,987 | $37,421 |
| 2014 | $3,073 | $45,669 | $8,033 | $37,636 |
| 2013 | $5,183 | $48,724 | $8,570 | $40,154 |
Source: Public Records
Map
Nearby Homes
- 40 Irene Dr
- 130 Hickory Lake
- 41 Paulette Dr
- 2819 Frank Scott Pkwy W
- 22 Elizabeth Dr
- 18 Jonathon Lee Dr
- 119 Freedom Dr
- 6204 Warren Dr
- 102 Kensington Heights Rd
- 128 Freedom Dr
- 11 Kingsway Dr
- 22 Terrace Dr
- 57 Cheshire Dr
- 4619 Ruth St
- 4720 Ruth St
- 408 Rosewood Ct
- 20 S 44th St
- 8 S 51st St
- 44 Gatewood Ct
- 119 S 37th St
- 328 Hickory Bend
- 322 Hickory Bend
- 320 Hickory Bend
- 330 Hickory Bend
- 318 Hickory Bend
- 329 Hickory Bend
- 401 Hickory Manor
- 3226 Frank Scott Pkwy W
- 321 Hickory Bend
- 405 Hickory Manor
- 325 Hickory Bend
- 312 Hickory Bend
- 319 Hickory Bend
- 323 Hickory Bend
- 317 Hickory Bend
- 327 Hickory Bend
- 3218 Frank Scott Pkwy W
- 3238 Frank Scott Pkwy W
- 310 Hickory Bend
- 409 Hickory Manor