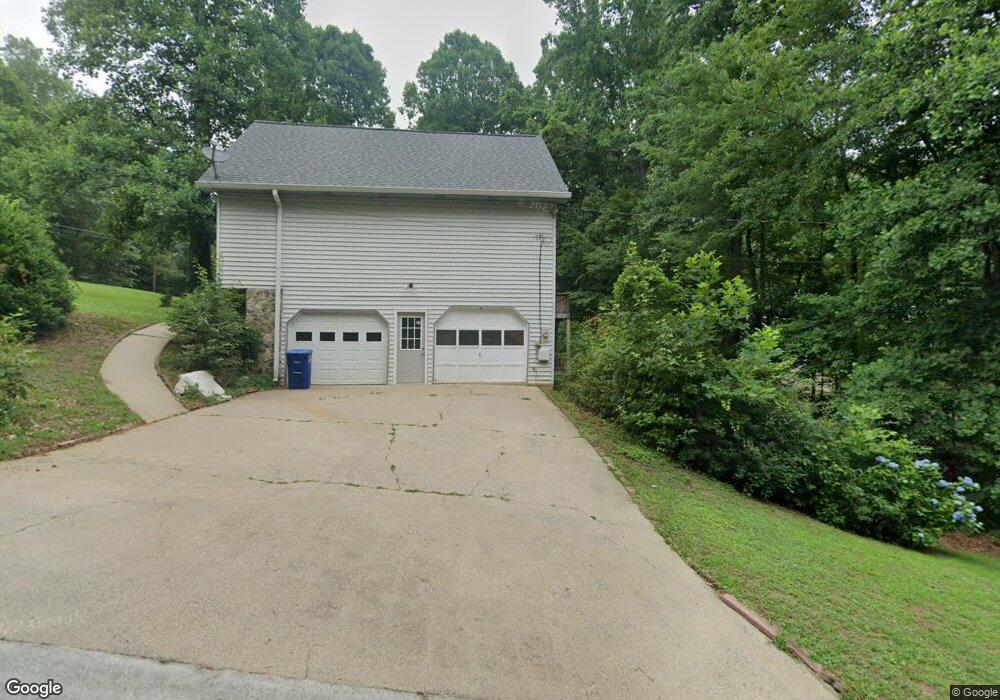
3240 Mills Ridge Dr Unit 1 Canton, GA 30114
Estimated Value: $385,618 - $389,000
4
Beds
3
Baths
1,794
Sq Ft
$216/Sq Ft
Est. Value
About This Home
This home is located at 3240 Mills Ridge Dr Unit 1, Canton, GA 30114 and is currently estimated at $387,309, approximately $215 per square foot. 3240 Mills Ridge Dr Unit 1 is a home located in Cherokee County with nearby schools including Liberty Elementary School, Freedom Middle School, and Cherokee High School.
Ownership History
Date
Name
Owned For
Owner Type
Purchase Details
Closed on
Nov 18, 2004
Sold by
Custom Investment Properties Inc
Bought by
Sellers Jimmie
Current Estimated Value
Home Financials for this Owner
Home Financials are based on the most recent Mortgage that was taken out on this home.
Original Mortgage
$176,000
Outstanding Balance
$86,521
Interest Rate
5.66%
Estimated Equity
$300,788
Purchase Details
Closed on
Oct 27, 2002
Sold by
Kelby James and Kelby Angela
Bought by
Custom Investment Properties
Purchase Details
Closed on
Jul 25, 1994
Sold by
Lawson Michael Teresa
Bought by
Lott Boyd Casandra
Home Financials for this Owner
Home Financials are based on the most recent Mortgage that was taken out on this home.
Original Mortgage
$84,550
Interest Rate
8.28%
Create a Home Valuation Report for This Property
The Home Valuation Report is an in-depth analysis detailing your home's value as well as a comparison with similar homes in the area
Home Values in the Area
Average Home Value in this Area
Purchase History
| Date | Buyer | Sale Price | Title Company |
|---|---|---|---|
| Sellers Jimmie | $50,000 | -- | |
| Custom Investment Properties | $123,000 | -- | |
| Lott Boyd Casandra | $89,000 | -- |
Source: Public Records
Mortgage History
| Date | Status | Borrower | Loan Amount |
|---|---|---|---|
| Open | Sellers Jimmie | $176,000 | |
| Previous Owner | Lott Boyd Casandra | $84,550 |
Source: Public Records
Tax History Compared to Growth
Tax History
| Year | Tax Paid | Tax Assessment Tax Assessment Total Assessment is a certain percentage of the fair market value that is determined by local assessors to be the total taxable value of land and additions on the property. | Land | Improvement |
|---|---|---|---|---|
| 2025 | $3,381 | $150,968 | $30,000 | $120,968 |
| 2024 | $3,106 | $137,048 | $30,000 | $107,048 |
| 2023 | $491 | $120,928 | $24,000 | $96,928 |
| 2022 | $597 | $101,408 | $24,000 | $77,408 |
| 2021 | $582 | $83,808 | $19,840 | $63,968 |
| 2020 | $550 | $74,448 | $17,400 | $57,048 |
| 2019 | $531 | $69,520 | $16,600 | $52,920 |
| 2018 | $458 | $60,400 | $15,200 | $45,200 |
| 2017 | $439 | $131,400 | $14,400 | $38,160 |
| 2016 | $423 | $116,700 | $12,000 | $34,680 |
| 2015 | $411 | $111,000 | $12,000 | $32,400 |
| 2014 | $374 | $101,700 | $12,000 | $28,680 |
Source: Public Records
Map
Nearby Homes
- 205 Lewis Ct
- 200 Lewis Ct
- 215 Lewis Ct
- 3261 Mills Ridge Dr
- 3281 Mills Ridge Dr Unit Basement Apartment
- 3281 Mills Ridge Dr
- 3180 Mills Ridge Dr
- 3241 Mills Ridge Dr
- 220 Lewis Ct Unit 1
- 210 Lewis Ct
- 3221 Mills Ridge Dr
- 3150 Mills Ridge Dr
- 3301 Mills Ridge Dr
- 3221 Mills Ridge Dr
- 400 Mills Lake Dr
- 3201 Mills Ridge Dr Unit I
- 3181 Mills Ridge Dr
- 3130 Mills Ridge Dr
- 3321 Mills Ridge Dr Unit 2
- 460 Mills Lake Dr