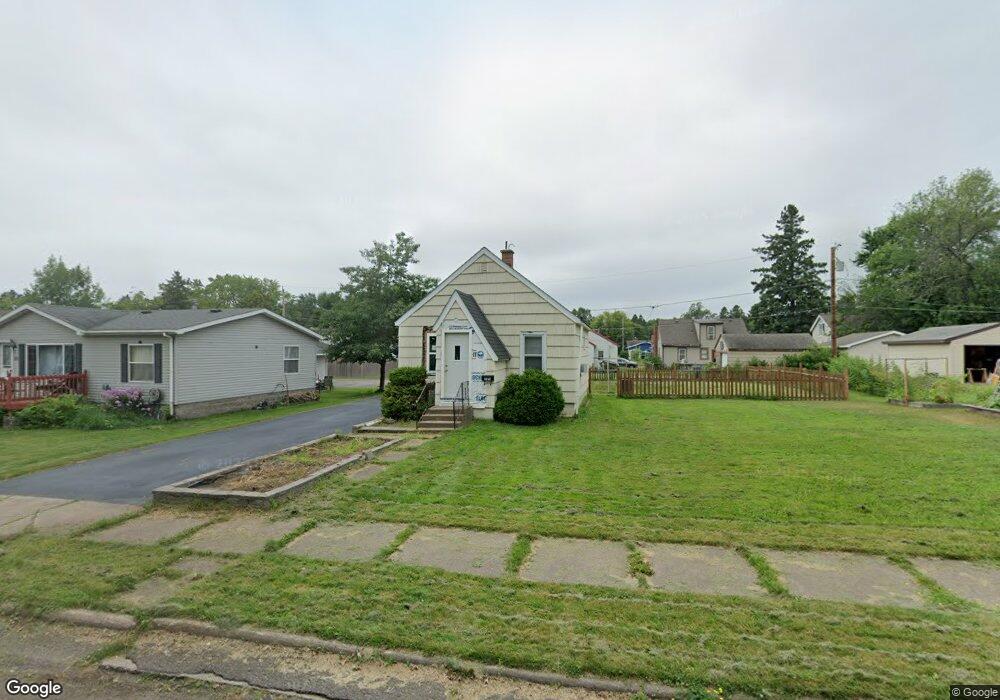
325 21st St Cloquet, MN 55720
Estimated Value: $116,000 - $161,000
1
Bed
1
Bath
516
Sq Ft
$269/Sq Ft
Est. Value
About This Home
This home is located at 325 21st St, Cloquet, MN 55720 and is currently estimated at $138,911, approximately $269 per square foot. 325 21st St is a home located in Carlton County with nearby schools including Washington Elementary School, Churchill Elementary School, and Cloquet Middle School.
Ownership History
Date
Name
Owned For
Owner Type
Purchase Details
Closed on
Aug 5, 2019
Sold by
Karp Nathan and Thorman Tanner J
Bought by
Thorman Tanner J
Current Estimated Value
Purchase Details
Closed on
Sep 19, 2014
Sold by
Thorman Properties Llc
Bought by
Thorman Tanner
Home Financials for this Owner
Home Financials are based on the most recent Mortgage that was taken out on this home.
Original Mortgage
$24,000
Interest Rate
3.26%
Mortgage Type
Commercial
Create a Home Valuation Report for This Property
The Home Valuation Report is an in-depth analysis detailing your home's value as well as a comparison with similar homes in the area
Home Values in the Area
Average Home Value in this Area
Purchase History
| Date | Buyer | Sale Price | Title Company |
|---|---|---|---|
| Thorman Tanner J | -- | -- | |
| Thorman Tanner | $30,000 | None Available |
Source: Public Records
Mortgage History
| Date | Status | Borrower | Loan Amount |
|---|---|---|---|
| Previous Owner | Thorman Tanner | $24,000 |
Source: Public Records
Tax History Compared to Growth
Tax History
| Year | Tax Paid | Tax Assessment Tax Assessment Total Assessment is a certain percentage of the fair market value that is determined by local assessors to be the total taxable value of land and additions on the property. | Land | Improvement |
|---|---|---|---|---|
| 2024 | $1,148 | $99,900 | $21,800 | $78,100 |
| 2023 | $1,220 | $96,400 | $21,800 | $74,600 |
| 2022 | $920 | $96,400 | $21,800 | $74,600 |
| 2021 | $948 | $69,600 | $18,900 | $50,700 |
| 2020 | $760 | $67,800 | $18,900 | $48,900 |
| 2019 | $650 | $55,100 | $20,000 | $35,100 |
| 2018 | $620 | $47,300 | $13,400 | $33,900 |
| 2017 | $640 | $44,900 | $13,400 | $31,500 |
| 2016 | $624 | $46,800 | $13,400 | $33,400 |
| 2015 | $572 | $27,100 | $8,100 | $19,000 |
| 2014 | -- | $27,100 | $8,100 | $19,000 |
| 2013 | -- | $45,100 | $13,400 | $31,700 |
Source: Public Records
Map
Nearby Homes