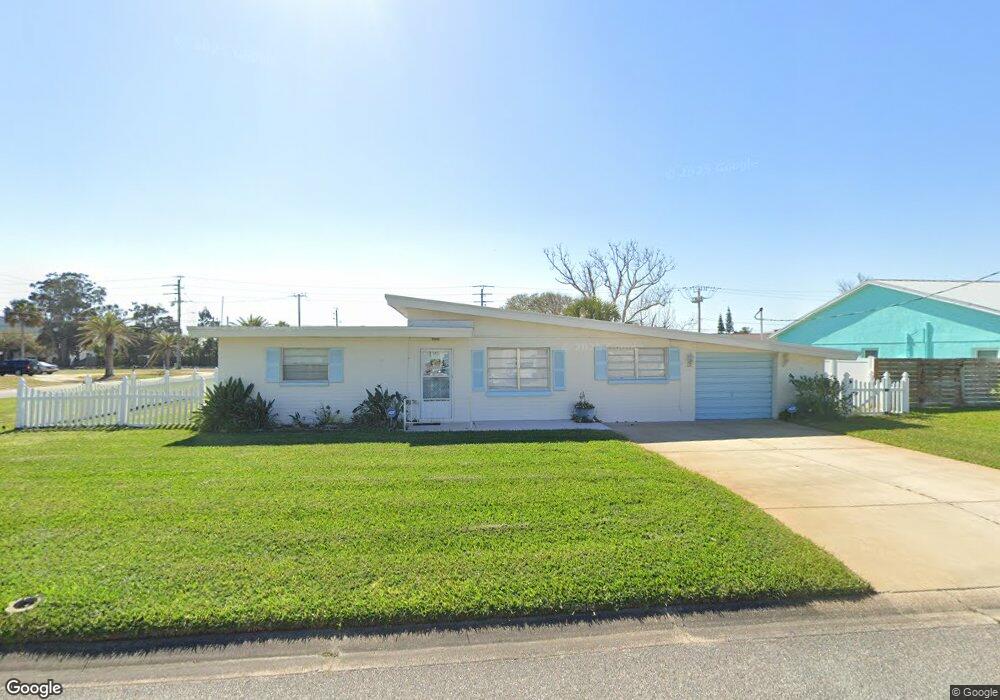
3264 La Paloma Ave Daytona Beach, FL 32118
Estimated Value: $285,000 - $328,000
2
Beds
1
Bath
1,080
Sq Ft
$287/Sq Ft
Est. Value
About This Home
This home is located at 3264 La Paloma Ave, Daytona Beach, FL 32118 and is currently estimated at $310,079, approximately $287 per square foot. 3264 La Paloma Ave is a home located in Volusia County with nearby schools including R.J. Longstreet Elementary School, Atlantic High School, and Silver Sands Middle School.
Ownership History
Date
Name
Owned For
Owner Type
Purchase Details
Closed on
Apr 13, 2015
Sold by
Trotter Miriam
Bought by
Trotter Rhonda and Trotter Milton Grant
Current Estimated Value
Home Financials for this Owner
Home Financials are based on the most recent Mortgage that was taken out on this home.
Original Mortgage
$70,000
Interest Rate
3.5%
Mortgage Type
Seller Take Back
Purchase Details
Closed on
Apr 29, 2010
Sold by
Trotter Miriam Devore and Trotter Milton
Bought by
Trotter Milton and Miriam Trotter Living Trust
Purchase Details
Closed on
Mar 7, 2000
Sold by
Castellano Michael and Castellano Barbara
Bought by
Trotter Miriam Devore
Purchase Details
Closed on
Apr 15, 1988
Bought by
Trotter Rhonda
Purchase Details
Closed on
Jun 15, 1984
Bought by
Trotter Rhonda
Purchase Details
Closed on
Jan 15, 1972
Bought by
Trotter Rhonda
Create a Home Valuation Report for This Property
The Home Valuation Report is an in-depth analysis detailing your home's value as well as a comparison with similar homes in the area
Home Values in the Area
Average Home Value in this Area
Purchase History
| Date | Buyer | Sale Price | Title Company |
|---|---|---|---|
| Trotter Rhonda | $90,000 | Surfside Title Services Inc | |
| Trotter Milton | -- | Surfside Title Services Inc | |
| Trotter Miriam Devore | $89,000 | -- | |
| Trotter Rhonda | $66,500 | -- | |
| Trotter Rhonda | $42,000 | -- | |
| Trotter Rhonda | $24,000 | -- |
Source: Public Records
Mortgage History
| Date | Status | Borrower | Loan Amount |
|---|---|---|---|
| Closed | Trotter Rhonda | $70,000 |
Source: Public Records
Tax History Compared to Growth
Tax History
| Year | Tax Paid | Tax Assessment Tax Assessment Total Assessment is a certain percentage of the fair market value that is determined by local assessors to be the total taxable value of land and additions on the property. | Land | Improvement |
|---|---|---|---|---|
| 2025 | $4,979 | $362,373 | $220,163 | $142,210 |
| 2024 | $4,979 | $363,500 | $220,163 | $143,337 |
| 2023 | $4,979 | $298,749 | $191,982 | $106,767 |
| 2022 | $4,498 | $247,924 | $138,702 | $109,222 |
| 2021 | $4,228 | $199,524 | $116,246 | $83,278 |
| 2020 | $3,999 | $188,120 | $115,365 | $72,755 |
| 2019 | $3,882 | $192,037 | $119,079 | $72,958 |
| 2018 | $3,488 | $157,545 | $81,810 | $75,735 |
| 2017 | $3,448 | $153,488 | $82,122 | $71,366 |
| 2016 | $3,225 | $137,289 | $0 | $0 |
| 2015 | $2,866 | $126,060 | $0 | $0 |
| 2014 | $2,627 | $117,551 | $0 | $0 |
Source: Public Records
Map
Nearby Homes
- 3244 S Peninsula Dr
- 0 S Peninsula Dr Unit MFRV4942972
- 0 S Peninsula Dr Unit 1219405
- 0 S Peninsula Dr
- 0 S Peninsula Dr Unit 1213918
- 2 Talo Cir
- 100 Talo Cir
- 3226 S Peninsula Dr
- 3245 S Atlantic Ave Unit 208
- 3255 S Atlantic Ave Unit 207
- 3255 S Atlantic Ave Unit 106
- 5 Talo Cir
- 3315 S Atlantic Ave Unit 1605
- 3315 S Atlantic Ave Unit 1406
- 3315 S Atlantic Ave Unit 1005
- 3315 S Atlantic Ave Unit 806
- 3315 S Atlantic Ave Unit 1707
- 3315 S Atlantic Ave Unit 408
- 3315 S Atlantic Ave Unit 1108
- 3315 S Atlantic Ave Unit 1106
- 3260 La Paloma Ave
- 3263 S Peninsula Dr
- 3263 La Paloma Ave
- 3256 La Paloma Ave
- 3259 S Peninsula Dr
- 3259 La Paloma Ave
- 106 Simpson Ave
- 100 Simpson Ave
- 108 Simpson Ave
- 3252 La Paloma Ave
- 3262 Esperanza Ave
- 3255 S Peninsula Dr
- 110 Simpson Ave
- 3258 Esperanza Ave
- 3251 La Paloma Ave
- 3303 S Peninsula Dr
- 3248 La Paloma Ave
- 0 S Peninsula Dr Unit 1102982
- 0 S Peninsula Dr Unit 1082853
- 0 S Peninsula Dr Unit 570295