Estimated Value: $883,765 - $1,088,000
2
Beds
1
Bath
720
Sq Ft
$1,372/Sq Ft
Est. Value
About This Home
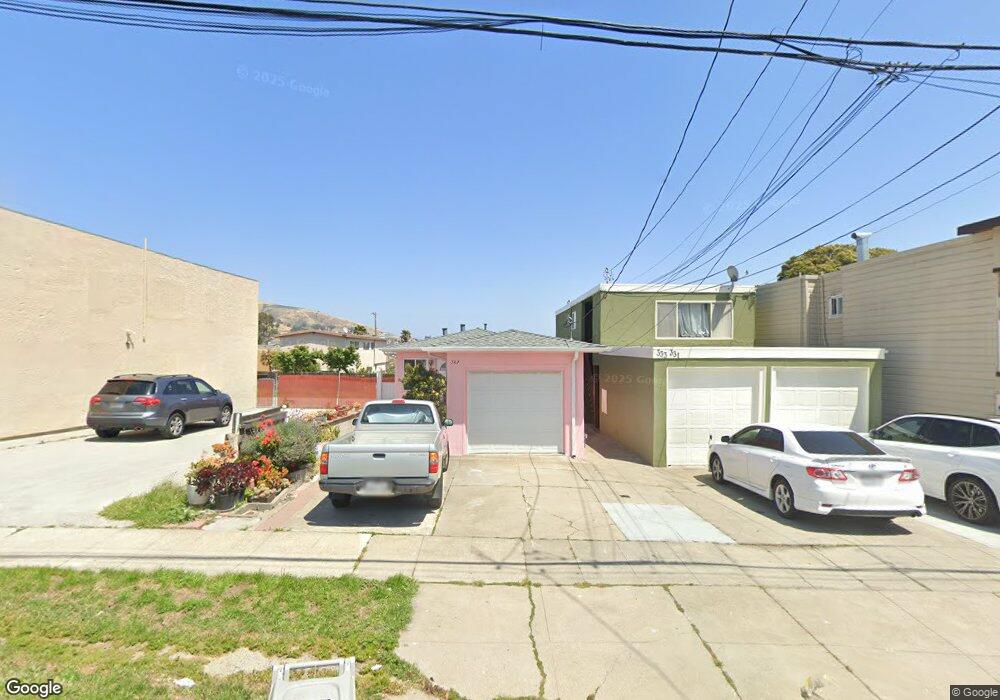
This home is located at 327 A St, South San Francisco, CA 94080 and is currently estimated at $987,691, approximately $1,371 per square foot. 327 A St is a home located in San Mateo County with nearby schools including Los Cerritos Elementary School, Alta Loma Middle School, and South San Francisco High School.
Ownership History
Date
Name
Owned For
Owner Type
Purchase Details
Closed on
May 21, 1999
Sold by
Begansky James P
Bought by
Cai Lifu and Chen Shaoling
Current Estimated Value
Home Financials for this Owner
Home Financials are based on the most recent Mortgage that was taken out on this home.
Original Mortgage
$72,000
Interest Rate
6.47%
Purchase Details
Closed on
Oct 7, 1994
Sold by
Machlowski Elizabeth
Bought by
Machlowski Krzystof
Home Financials for this Owner
Home Financials are based on the most recent Mortgage that was taken out on this home.
Original Mortgage
$130,000
Interest Rate
8.5%
Purchase Details
Closed on
Oct 6, 1994
Sold by
Blair Patricia A and Machlowski Krzystof
Bought by
Gumba Joyce A
Home Financials for this Owner
Home Financials are based on the most recent Mortgage that was taken out on this home.
Original Mortgage
$130,000
Interest Rate
8.5%
Purchase Details
Closed on
May 5, 1994
Sold by
Equity Holders Servicing Co
Bought by
Blair Patricia A and Machlowski Krzystof
Create a Home Valuation Report for This Property
The Home Valuation Report is an in-depth analysis detailing your home's value as well as a comparison with similar homes in the area
Home Values in the Area
Average Home Value in this Area
Purchase History
| Date | Buyer | Sale Price | Title Company |
|---|---|---|---|
| Cai Lifu | $222,000 | Old Republic Title Ins Compa | |
| Machlowski Krzystof | -- | American Title Company | |
| Gumba Joyce A | $163,000 | American Title Company | |
| Blair Patricia A | $52,001 | -- |
Source: Public Records
Mortgage History
| Date | Status | Borrower | Loan Amount |
|---|---|---|---|
| Closed | Cai Lifu | $72,000 | |
| Previous Owner | Gumba Joyce A | $130,000 |
Source: Public Records
Tax History Compared to Growth
Tax History
| Year | Tax Paid | Tax Assessment Tax Assessment Total Assessment is a certain percentage of the fair market value that is determined by local assessors to be the total taxable value of land and additions on the property. | Land | Improvement |
|---|---|---|---|---|
| 2025 | $4,502 | $348,002 | $174,001 | $174,001 |
| 2023 | $4,502 | $334,492 | $167,246 | $167,246 |
| 2022 | $4,186 | $327,934 | $163,967 | $163,967 |
| 2021 | $4,127 | $321,504 | $160,752 | $160,752 |
| 2020 | $4,073 | $318,208 | $159,104 | $159,104 |
| 2019 | $4,033 | $311,970 | $155,985 | $155,985 |
| 2018 | $3,937 | $305,854 | $152,927 | $152,927 |
| 2017 | $3,814 | $299,858 | $149,929 | $149,929 |
| 2016 | $3,696 | $293,980 | $146,990 | $146,990 |
| 2015 | $3,633 | $289,566 | $144,783 | $144,783 |
| 2014 | $3,549 | $283,894 | $141,947 | $141,947 |
Source: Public Records
Map
Nearby Homes
- 247 Rainier Ave
- 719 Circle Ct
- 632 1st Ln
- 645 Baden Ave Unit 4
- 729 Grand Ave
- 311 Magnolia Ave
- 214 Manor Dr
- 577 Miller Ave
- 573 Miller Ave
- 0 Indio Dr
- 728 Cottonwood Ave
- 453 Grand Ave
- 20 Maple Ave
- 322 Commercial Ave
- 400 Miller Ave
- 123 Appian Way
- 829 Stonegate Dr
- 252 Sequoia Ave
- 19 Escanyo Dr
- 1488 El Camino Real Unit 211