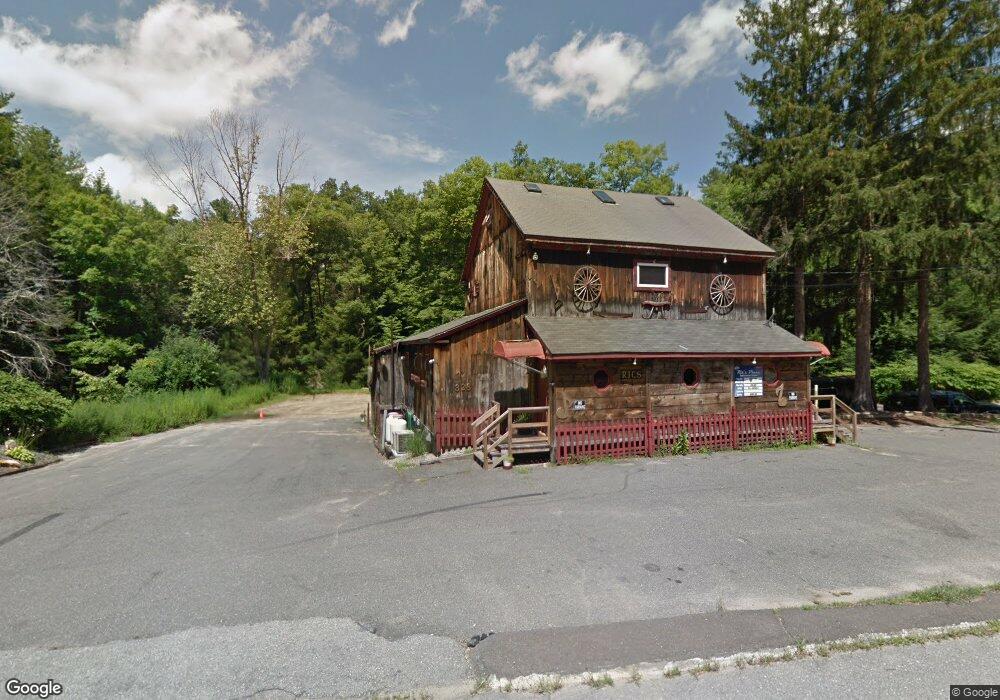
328 East St Stafford Springs, CT 06076
Stafford NeighborhoodEstimated Value: $725,473
--
Bed
--
Bath
2,820
Sq Ft
$257/Sq Ft
Est. Value
About This Home
This home is located at 328 East St, Stafford Springs, CT 06076 and is currently estimated at $725,473, approximately $257 per square foot. 328 East St is a home located in Tolland County with nearby schools including Stafford Elementary School, Stafford Middle School, and Stafford High School.
Ownership History
Date
Name
Owned For
Owner Type
Purchase Details
Closed on
Aug 11, 2016
Sold by
Bacchiochi Allen R
Bought by
Bacchiochi Allen R and Bacchiochi Kaylina J
Current Estimated Value
Purchase Details
Closed on
Oct 1, 2012
Sold by
Near The Lake Cafe Llc
Bought by
Circle G Co
Home Financials for this Owner
Home Financials are based on the most recent Mortgage that was taken out on this home.
Original Mortgage
$180,000
Interest Rate
3.62%
Purchase Details
Closed on
Aug 24, 2006
Sold by
Friedland Jeffrey
Bought by
Near Lake Cafe Llc
Home Financials for this Owner
Home Financials are based on the most recent Mortgage that was taken out on this home.
Original Mortgage
$200,000
Interest Rate
7.75%
Mortgage Type
Commercial
Purchase Details
Closed on
Nov 29, 2004
Sold by
Munn Robert
Bought by
Friedland Jeffrey
Create a Home Valuation Report for This Property
The Home Valuation Report is an in-depth analysis detailing your home's value as well as a comparison with similar homes in the area
Home Values in the Area
Average Home Value in this Area
Purchase History
| Date | Buyer | Sale Price | Title Company |
|---|---|---|---|
| Bacchiochi Allen R | -- | -- | |
| Circle G Co | $216,000 | -- | |
| Near Lake Cafe Llc | $450,000 | -- | |
| Near Lake Cafe Llc | $450,000 | -- | |
| Friedland Jeffrey | $440,000 | -- | |
| Friedland Jeffrey | $440,000 | -- |
Source: Public Records
Mortgage History
| Date | Status | Borrower | Loan Amount |
|---|---|---|---|
| Previous Owner | Friedland Jeffrey | $180,000 | |
| Previous Owner | Friedland Jeffrey | $200,000 |
Source: Public Records
Tax History Compared to Growth
Tax History
| Year | Tax Paid | Tax Assessment Tax Assessment Total Assessment is a certain percentage of the fair market value that is determined by local assessors to be the total taxable value of land and additions on the property. | Land | Improvement |
|---|---|---|---|---|
| 2025 | $7,688 | $132,720 | $38,500 | $94,220 |
| 2024 | $5,122 | $132,720 | $38,500 | $94,220 |
| 2023 | $4,879 | $132,720 | $38,500 | $94,220 |
| 2022 | $4,749 | $132,720 | $38,500 | $94,220 |
| 2021 | $6,768 | $132,720 | $38,500 | $94,220 |
| 2020 | $5,722 | $125,510 | $38,500 | $87,010 |
| 2019 | $4,384 | $125,510 | $38,500 | $87,010 |
| 2018 | $4,300 | $125,510 | $38,500 | $87,010 |
| 2017 | $4,259 | $125,510 | $38,500 | $87,010 |
| 2016 | $5,309 | $125,510 | $38,500 | $87,010 |
| 2015 | $4,206 | $118,440 | $38,500 | $79,940 |
| 2014 | $3,912 | $118,440 | $38,500 | $79,940 |
Source: Public Records
Map
Nearby Homes