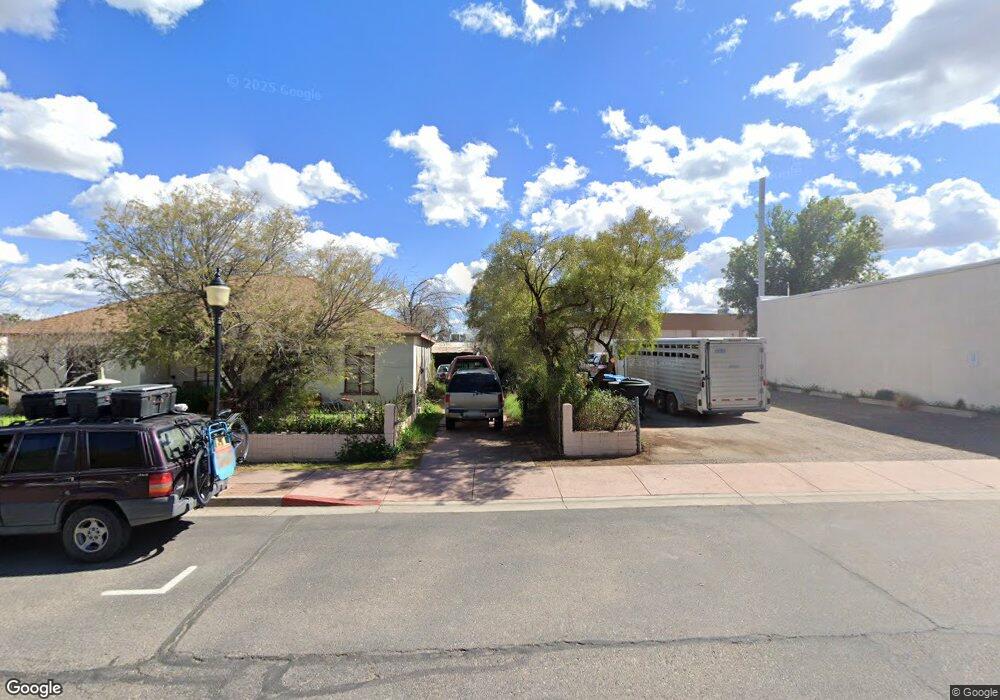
32828 N 228th Wickenburg, AZ 85390
Estimated Value: $422,000 - $597,000
4
Beds
2
Baths
1,403
Sq Ft
$389/Sq Ft
Est. Value
About This Home
This home is located at 32828 N 228th, Wickenburg, AZ 85390 and is currently estimated at $545,978, approximately $389 per square foot. 32828 N 228th is a home located in Maricopa County with nearby schools including Nadaburg Elementary School.
Ownership History
Date
Name
Owned For
Owner Type
Purchase Details
Closed on
Jul 1, 2023
Sold by
Simon Scott
Bought by
Simon Family Trust and Simon
Current Estimated Value
Purchase Details
Closed on
Mar 7, 2016
Sold by
Field Wesley Watson
Bought by
Simon Scott
Home Financials for this Owner
Home Financials are based on the most recent Mortgage that was taken out on this home.
Original Mortgage
$135,120
Interest Rate
3.79%
Mortgage Type
New Conventional
Purchase Details
Closed on
Dec 21, 2011
Sold by
Proficio Bank
Bought by
Field Wesley Watson
Purchase Details
Closed on
Oct 20, 2011
Sold by
Field Jessie
Bought by
Field Wesley Watson
Home Financials for this Owner
Home Financials are based on the most recent Mortgage that was taken out on this home.
Original Mortgage
$78,946
Interest Rate
4.25%
Mortgage Type
FHA
Purchase Details
Closed on
Nov 4, 2004
Sold by
C M W Enterprises
Bought by
Infinite Development Llc
Create a Home Valuation Report for This Property
The Home Valuation Report is an in-depth analysis detailing your home's value as well as a comparison with similar homes in the area
Home Values in the Area
Average Home Value in this Area
Purchase History
| Date | Buyer | Sale Price | Title Company |
|---|---|---|---|
| Simon Family Trust | -- | None Listed On Document | |
| Simon Scott | $168,900 | Chicago Title Agency Inc | |
| Field Wesley Watson | $81,000 | First American Title Ins Co | |
| Field Wesley Watson | -- | First American Title Ins Co | |
| Infinite Development Llc | $19,952 | -- |
Source: Public Records
Mortgage History
| Date | Status | Borrower | Loan Amount |
|---|---|---|---|
| Previous Owner | Simon Scott | $135,120 | |
| Previous Owner | Field Wesley Watson | $78,946 |
Source: Public Records
Tax History Compared to Growth
Tax History
| Year | Tax Paid | Tax Assessment Tax Assessment Total Assessment is a certain percentage of the fair market value that is determined by local assessors to be the total taxable value of land and additions on the property. | Land | Improvement |
|---|---|---|---|---|
| 2025 | $1,262 | $14,281 | -- | -- |
| 2024 | $1,385 | $13,601 | -- | -- |
| 2023 | $1,385 | $31,460 | $6,290 | $25,170 |
| 2022 | $996 | $26,550 | $5,310 | $21,240 |
| 2021 | $1,145 | $22,960 | $4,590 | $18,370 |
| 2020 | $1,140 | $23,310 | $4,660 | $18,650 |
| 2019 | $1,036 | $17,920 | $3,580 | $14,340 |
| 2018 | $1,021 | $14,270 | $2,850 | $11,420 |
| 2017 | $1,029 | $12,410 | $2,480 | $9,930 |
| 2016 | $940 | $13,010 | $2,600 | $10,410 |
| 2015 | $888 | $12,560 | $2,510 | $10,050 |
Source: Public Records
Map
Nearby Homes
- 32828 N 228th Dr
- 0 W Myers St Unit 6896442
- 0 W Myers St Unit 6896371
- 0 W Myers St Unit 6896404
- 0 W Myers St Unit 6896473
- 0 W Myers St Unit 6896455
- 28862 N 226th Ave
- 22824 W Myers St
- 32431 N 226th Dr
- 32114 N 229th Ave
- 32807 N 225th Ave
- 22437 W Happy Ln
- 22415 W Mellow St
- 32325 N 224th Ave
- 22330 W Harmony St
- 22325 W Harmony St
- 22315 W Harmony St
- 32011 N 225th Dr
- 32614 N 223rd Ave
- 32650 N 223rd Ave
- 32828 N 228th Dr Unit N
- 0 N 228th (Apn 503-17-007u) Dr Unit U 5848205
- 32810 N 228th Dr
- 32810 N 228th Dr
- 32810 N 228th Dr Unit N
- 328xx N 228th (Apn 503-17-007u) Dr
- 328xx N 228th (Apn 503-17-007u) Dr
- 32 N 228 Dr Unit 3
- 32 N 228 Dr Unit 1
- 328XX W Dove Valley Rd Unit 4
- 328XX W Dove Valley Rd
- x2 N 226th Ave
- x1 N 227th Ave
- x1 N 226th Ave
- 32810 N 227th Ave
- x3 N 226th Ave
- 32866 N 227th Ave
- 32807 N 227th Ave
- 32821 N 227th Ave
- 22800 W Dove Valley Rd Unit 50317007T