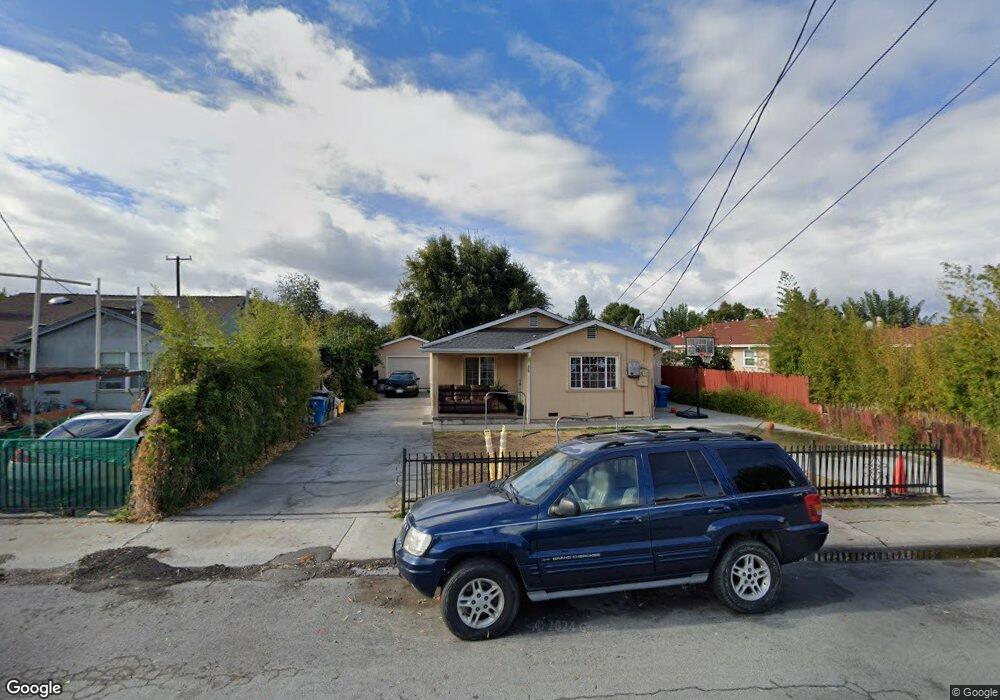
329 Serrano Ave San Jose, CA 95127
Alum Rock NeighborhoodEstimated Value: $1,069,000 - $1,294,000
4
Beds
2
Baths
1,055
Sq Ft
$1,096/Sq Ft
Est. Value
About This Home
This home is located at 329 Serrano Ave, San Jose, CA 95127 and is currently estimated at $1,156,341, approximately $1,096 per square foot. 329 Serrano Ave is a home located in Santa Clara County with nearby schools including Horace Cureton Elementary School, Joseph George Middle School, and James Lick High School.
Ownership History
Date
Name
Owned For
Owner Type
Purchase Details
Closed on
Mar 14, 2008
Sold by
Rodriguez Cesar
Bought by
Rodriguez Cesar and Rodriguez Fernando
Current Estimated Value
Purchase Details
Closed on
Jan 4, 2006
Sold by
Lam Kung and Dang Linh My
Bought by
Rodriguez Cesar
Home Financials for this Owner
Home Financials are based on the most recent Mortgage that was taken out on this home.
Original Mortgage
$112,000
Interest Rate
6.32%
Mortgage Type
Credit Line Revolving
Purchase Details
Closed on
Oct 25, 1993
Sold by
Lam Binh B and Lam Ngoc K
Bought by
Lam Binh B and Lam Ngoc K
Home Financials for this Owner
Home Financials are based on the most recent Mortgage that was taken out on this home.
Original Mortgage
$128,000
Interest Rate
6.97%
Create a Home Valuation Report for This Property
The Home Valuation Report is an in-depth analysis detailing your home's value as well as a comparison with similar homes in the area
Home Values in the Area
Average Home Value in this Area
Purchase History
| Date | Buyer | Sale Price | Title Company |
|---|---|---|---|
| Rodriguez Cesar | -- | Fidelity National Title Co | |
| Rodriguez Cesar | $560,000 | Chicago Title | |
| Lam Binh B | -- | Fidelity National Title Comp |
Source: Public Records
Mortgage History
| Date | Status | Borrower | Loan Amount |
|---|---|---|---|
| Previous Owner | Rodriguez Cesar | $112,000 | |
| Previous Owner | Rodriguez Cesar | $448,000 | |
| Previous Owner | Lam Binh B | $128,000 |
Source: Public Records
Tax History Compared to Growth
Tax History
| Year | Tax Paid | Tax Assessment Tax Assessment Total Assessment is a certain percentage of the fair market value that is determined by local assessors to be the total taxable value of land and additions on the property. | Land | Improvement |
|---|---|---|---|---|
| 2025 | $13,027 | $933,464 | $612,224 | $321,240 |
| 2024 | $13,027 | $892,122 | $600,220 | $291,902 |
| 2023 | $12,431 | $874,630 | $588,451 | $286,179 |
| 2022 | $12,120 | $857,481 | $576,913 | $280,568 |
| 2021 | $11,722 | $840,668 | $565,601 | $275,067 |
| 2020 | $11,567 | $832,049 | $559,802 | $272,247 |
| 2019 | $11,267 | $815,735 | $548,826 | $266,909 |
| 2018 | $11,211 | $799,741 | $538,065 | $261,676 |
| 2017 | $10,713 | $740,000 | $484,000 | $256,000 |
| 2016 | $8,994 | $636,400 | $427,400 | $209,000 |
| 2015 | $7,955 | $544,000 | $366,000 | $178,000 |
| 2014 | $7,138 | $484,600 | $326,000 | $158,600 |
Source: Public Records
Map
Nearby Homes
- 3405 E Hills Dr
- 567 Nordyke Dr
- 3014 Florence Ave
- 14545 Jerilyn Dr
- 366 Cureton Place
- 2925 Florence Ave Unit 17
- 2925 Florence Ave Unit 67
- 2925 Florence Ave Unit 82
- 13754 Highwood Dr
- 14440 Victoria Ct
- 1122 Lancelot Ln
- 3434 Dominick Ct
- 3253 Arthur Ave
- 13612 Emilie Dr
- 75 S Cragmont Ave
- 80 Pickford Ave
- 236 S Claremont Ave
- 160 Talmadge Ave
- 10170 Regan St
- 10150 Clayton Rd
- 323 Serrano Ave
- 333 Serrano Ave
- 315 Serrano Ave
- 330 Emerick Ave
- 369 Serrano Ave
- 320 Emerick Ave
- 3255 Edna Place
- 347 Serrano Ave
- 310 Emerick Ave
- 324 Serrano Ave
- 330 Serrano Ave
- 318 Serrano Ave
- 3270 E Hills Dr
- 336 Serrano Ave
- 3260 E Hills Dr
- 3250 E Hills Dr
- 310 Serrano Ave
- 25 Edna Place
- 3290 E Hills Dr
- 353 Serrano Ave