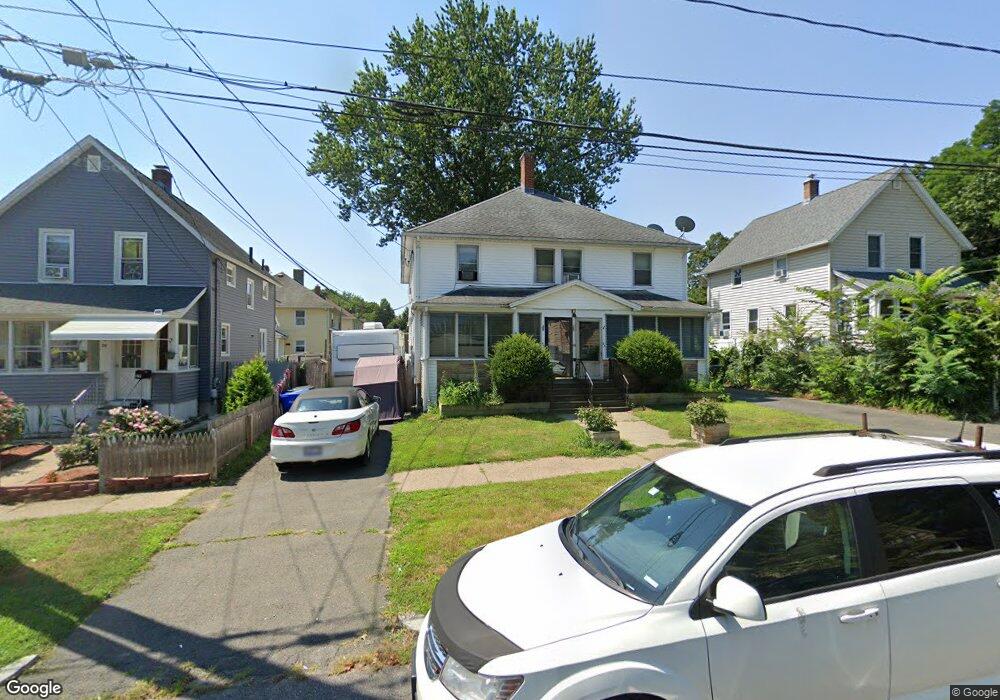
33 Falmouth St Unit 35 Indian Orchard, MA 01151
Indian Orchard NeighborhoodEstimated Value: $300,000 - $366,000
6
Beds
2
Baths
2,736
Sq Ft
$120/Sq Ft
Est. Value
About This Home
This home is located at 33 Falmouth St Unit 35, Indian Orchard, MA 01151 and is currently estimated at $329,682, approximately $120 per square foot. 33 Falmouth St Unit 35 is a home located in Hampden County with nearby schools including Indian Orchard Elementary School, John F. Kennedy Academy, and Roger L. Putnam Vocational Technical Academy.
Ownership History
Date
Name
Owned For
Owner Type
Purchase Details
Closed on
Oct 31, 2023
Sold by
Jones Jr Melvin Est and Jones
Bought by
Bercy Equonda S
Current Estimated Value
Purchase Details
Closed on
Sep 5, 2008
Sold by
Kielbania Richard E
Bought by
Jones Melvin
Home Financials for this Owner
Home Financials are based on the most recent Mortgage that was taken out on this home.
Original Mortgage
$135,200
Interest Rate
6.69%
Mortgage Type
Purchase Money Mortgage
Create a Home Valuation Report for This Property
The Home Valuation Report is an in-depth analysis detailing your home's value as well as a comparison with similar homes in the area
Home Values in the Area
Average Home Value in this Area
Purchase History
| Date | Buyer | Sale Price | Title Company |
|---|---|---|---|
| Bercy Equonda S | -- | None Available | |
| Jones Melvin | $169,000 | -- |
Source: Public Records
Mortgage History
| Date | Status | Borrower | Loan Amount |
|---|---|---|---|
| Previous Owner | Jones Melvin | $135,200 |
Source: Public Records
Tax History Compared to Growth
Tax History
| Year | Tax Paid | Tax Assessment Tax Assessment Total Assessment is a certain percentage of the fair market value that is determined by local assessors to be the total taxable value of land and additions on the property. | Land | Improvement |
|---|---|---|---|---|
| 2025 | $4,108 | $262,000 | $42,700 | $219,300 |
| 2024 | $3,984 | $248,100 | $39,900 | $208,200 |
| 2023 | $3,874 | $227,200 | $32,700 | $194,500 |
| 2022 | $3,318 | $176,300 | $30,600 | $145,700 |
| 2021 | $3,107 | $164,400 | $27,800 | $136,600 |
| 2020 | $3,127 | $160,100 | $27,800 | $132,300 |
| 2019 | $2,608 | $132,500 | $28,800 | $103,700 |
| 2018 | $2,688 | $136,600 | $28,800 | $107,800 |
| 2017 | $2,399 | $122,000 | $24,500 | $97,500 |
| 2016 | $2,308 | $117,400 | $24,500 | $92,900 |
| 2015 | $2,262 | $115,000 | $24,500 | $90,500 |
Source: Public Records
Map
Nearby Homes
- 25 Burke St
- 63 Parker St
- 27 Goodwin St
- 0 Parker St (Ws) Unit 73388310
- 188B Parker St
- 188 Parker St
- 20 Connolly St
- 105 Mazarin St
- 96 Lyons St
- 34-36 Mazarin St
- 130 Mazarin St
- 36-38 Montcalm St
- 13 - 13.5 Weston St
- 0 Center St Unit 73415933
- 295 Main St
- 252 Parker St
- 70 Nagle St
- 201 Verge St
- 89-91 Stony Hill Rd
- 501 Oak St
- 39 Falmouth St
- 29 Falmouth St
- 28 Burke St
- 28 Burke St Unit 1
- 13 Lawe St
- 22 Burke St Unit 24
- 22-24 Burke St
- 9 Lawe St
- 34 Falmouth St Unit 36
- 34-36 Falmouth St
- 30 Falmouth St
- 40 Falmouth St
- 35 Burke St
- 18 Burke St Unit 20
- 18-20 Burke St
- 41 Lawe St Unit 43
- 41-43 Lawe St
- 19 Lawe St Unit 21
- 19 Lawe St
- 12-16 1/2 Parker St