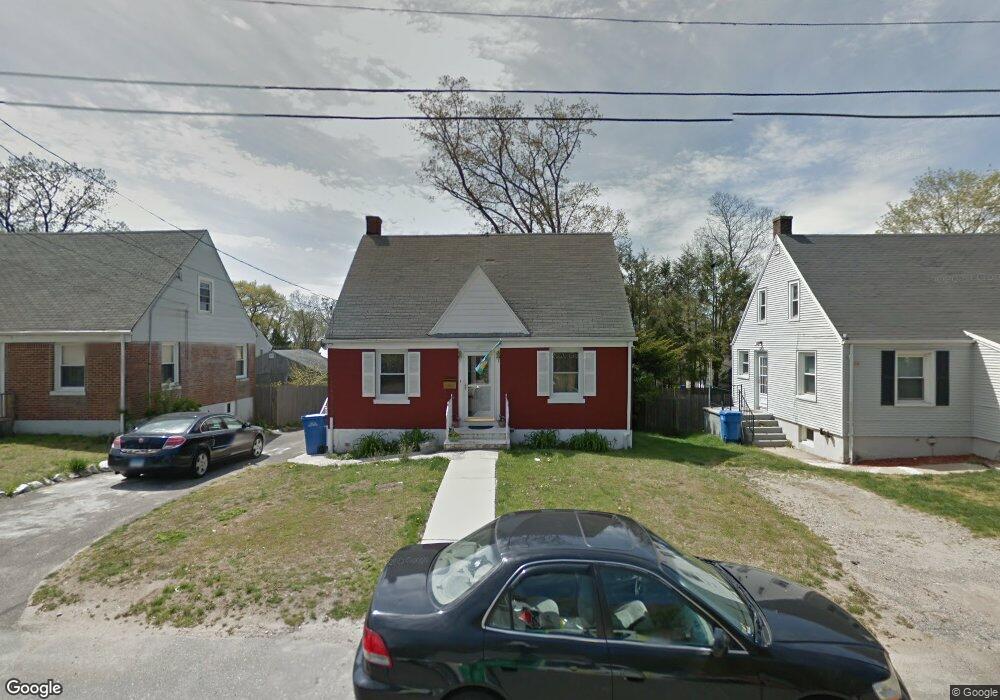
33 Houston St Waterbury, CT 06704
North End District NeighborhoodEstimated Value: $271,000 - $303,000
4
Beds
2
Baths
1,080
Sq Ft
$265/Sq Ft
Est. Value
About This Home
This home is located at 33 Houston St, Waterbury, CT 06704 and is currently estimated at $286,085, approximately $264 per square foot. 33 Houston St is a home located in New Haven County with nearby schools including F. J. Kingsbury School, North End Middle School, and Wilby High School.
Ownership History
Date
Name
Owned For
Owner Type
Purchase Details
Closed on
Sep 7, 2007
Sold by
Nightingale Armando
Bought by
Correa Alberto
Current Estimated Value
Home Financials for this Owner
Home Financials are based on the most recent Mortgage that was taken out on this home.
Original Mortgage
$159,900
Outstanding Balance
$101,189
Interest Rate
6.74%
Mortgage Type
Purchase Money Mortgage
Estimated Equity
$184,896
Purchase Details
Closed on
Aug 20, 2004
Sold by
Department Of Housing & Urban Dev
Bought by
Nightingale Armando
Home Financials for this Owner
Home Financials are based on the most recent Mortgage that was taken out on this home.
Original Mortgage
$35,100
Interest Rate
6.03%
Mortgage Type
Purchase Money Mortgage
Purchase Details
Closed on
Nov 8, 2000
Sold by
Amer Rlty & Mtg Co
Bought by
Medina Nevdin
Home Financials for this Owner
Home Financials are based on the most recent Mortgage that was taken out on this home.
Original Mortgage
$68,900
Interest Rate
7.81%
Mortgage Type
Purchase Money Mortgage
Purchase Details
Closed on
Jan 23, 1990
Sold by
Cortigiano Florence
Bought by
Capone Leonard A
Home Financials for this Owner
Home Financials are based on the most recent Mortgage that was taken out on this home.
Original Mortgage
$65,260
Interest Rate
9.68%
Mortgage Type
Purchase Money Mortgage
Create a Home Valuation Report for This Property
The Home Valuation Report is an in-depth analysis detailing your home's value as well as a comparison with similar homes in the area
Home Values in the Area
Average Home Value in this Area
Purchase History
| Date | Buyer | Sale Price | Title Company |
|---|---|---|---|
| Correa Alberto | $159,900 | -- | |
| Nightingale Armando | $78,000 | -- | |
| Medina Nevdin | $70,800 | -- | |
| Capone Leonard A | $87,000 | -- |
Source: Public Records
Mortgage History
| Date | Status | Borrower | Loan Amount |
|---|---|---|---|
| Open | Capone Leonard A | $159,900 | |
| Previous Owner | Capone Leonard A | $35,100 | |
| Previous Owner | Capone Leonard A | $68,900 | |
| Previous Owner | Capone Leonard A | $65,260 | |
| Closed | Capone Leonard A | $3,000 |
Source: Public Records
Tax History Compared to Growth
Tax History
| Year | Tax Paid | Tax Assessment Tax Assessment Total Assessment is a certain percentage of the fair market value that is determined by local assessors to be the total taxable value of land and additions on the property. | Land | Improvement |
|---|---|---|---|---|
| 2025 | $4,654 | $103,460 | $18,200 | $85,260 |
| 2024 | $5,115 | $103,460 | $18,200 | $85,260 |
| 2023 | $5,606 | $103,460 | $18,200 | $85,260 |
| 2022 | $3,715 | $61,700 | $18,230 | $43,470 |
| 2021 | $3,715 | $61,700 | $18,230 | $43,470 |
| 2020 | $3,715 | $61,700 | $18,230 | $43,470 |
| 2019 | $3,715 | $61,700 | $18,230 | $43,470 |
| 2018 | $3,715 | $61,700 | $18,230 | $43,470 |
| 2017 | $3,965 | $65,850 | $18,230 | $47,620 |
| 2016 | $3,965 | $65,850 | $18,230 | $47,620 |
| 2015 | $3,834 | $65,850 | $18,230 | $47,620 |
| 2014 | $3,834 | $65,850 | $18,230 | $47,620 |
Source: Public Records
Map
Nearby Homes