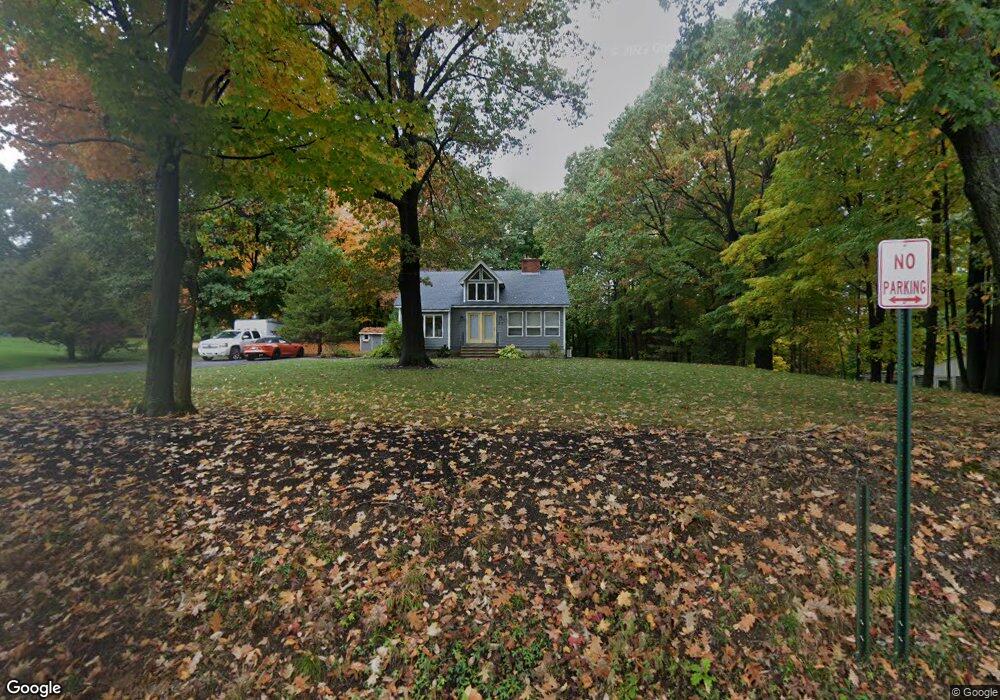
33 Lowe St Leominster, MA 01453
Estimated Value: $498,000 - $628,000
4
Beds
2
Baths
2,262
Sq Ft
$242/Sq Ft
Est. Value
About This Home
This home is located at 33 Lowe St, Leominster, MA 01453 and is currently estimated at $548,422, approximately $242 per square foot. 33 Lowe St is a home located in Worcester County with nearby schools including Leominster High School, St. Leo School, and St. Anna Catholic School.
Ownership History
Date
Name
Owned For
Owner Type
Purchase Details
Closed on
Jan 19, 2023
Sold by
Duff Carrie E
Bought by
Carrie Duff Ft
Current Estimated Value
Purchase Details
Closed on
Jul 8, 2010
Sold by
Fraier Jane A and Bundy Jeanette
Bought by
Duff Carrie E
Home Financials for this Owner
Home Financials are based on the most recent Mortgage that was taken out on this home.
Original Mortgage
$193,600
Interest Rate
4.78%
Mortgage Type
Purchase Money Mortgage
Purchase Details
Closed on
Sep 13, 2007
Sold by
Iacoboni John D and Iacoboni Ann B
Bought by
Bundy Jeanette
Create a Home Valuation Report for This Property
The Home Valuation Report is an in-depth analysis detailing your home's value as well as a comparison with similar homes in the area
Home Values in the Area
Average Home Value in this Area
Purchase History
| Date | Buyer | Sale Price | Title Company |
|---|---|---|---|
| Carrie Duff Ft | -- | None Available | |
| Duff Carrie E | $242,000 | -- | |
| Bundy Jeanette | $295,000 | -- |
Source: Public Records
Mortgage History
| Date | Status | Borrower | Loan Amount |
|---|---|---|---|
| Previous Owner | Duff Carrie E | $193,600 |
Source: Public Records
Tax History Compared to Growth
Tax History
| Year | Tax Paid | Tax Assessment Tax Assessment Total Assessment is a certain percentage of the fair market value that is determined by local assessors to be the total taxable value of land and additions on the property. | Land | Improvement |
|---|---|---|---|---|
| 2025 | $6,473 | $461,400 | $162,600 | $298,800 |
| 2024 | $5,897 | $406,400 | $155,000 | $251,400 |
| 2023 | $5,479 | $352,600 | $134,900 | $217,700 |
| 2022 | $5,114 | $308,800 | $117,300 | $191,500 |
| 2021 | $4,734 | $261,100 | $91,400 | $169,700 |
| 2020 | $4,380 | $243,600 | $91,400 | $152,200 |
| 2019 | $4,474 | $241,300 | $87,200 | $154,100 |
| 2018 | $4,498 | $232,700 | $84,600 | $148,100 |
| 2017 | $4,603 | $233,300 | $79,200 | $154,100 |
| 2016 | $4,406 | $225,000 | $79,200 | $145,800 |
| 2015 | $4,374 | $225,000 | $79,200 | $145,800 |
| 2014 | $4,209 | $222,800 | $83,200 | $139,600 |
Source: Public Records
Map
Nearby Homes