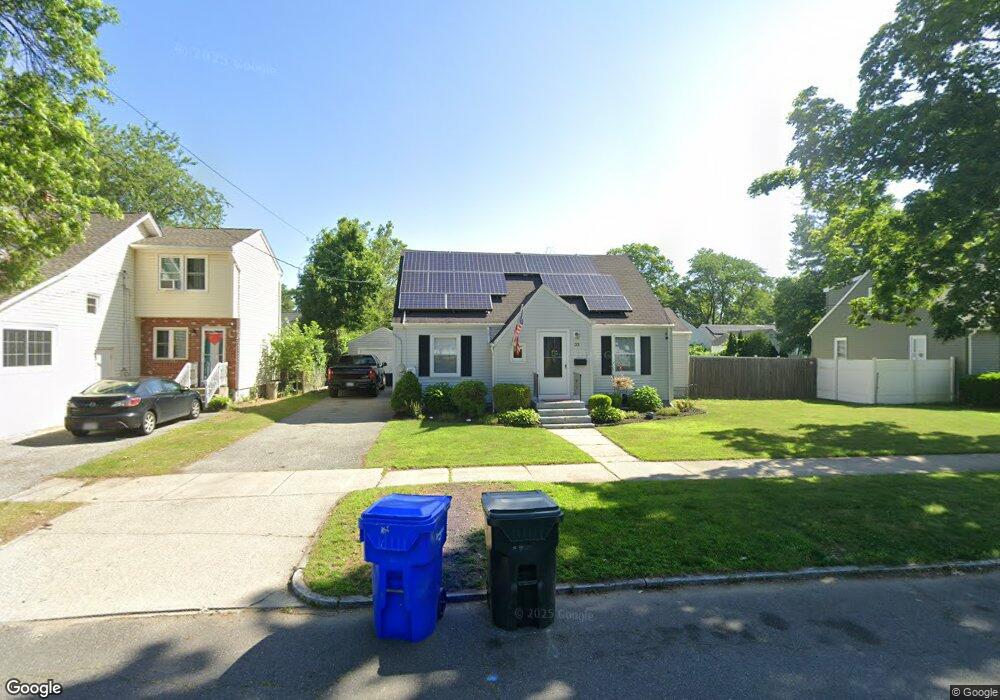
33 Michigan St Indian Orchard, MA 01151
Indian Orchard NeighborhoodEstimated Value: $260,000 - $354,000
2
Beds
1
Bath
936
Sq Ft
$320/Sq Ft
Est. Value
About This Home
This home is located at 33 Michigan St, Indian Orchard, MA 01151 and is currently estimated at $299,198, approximately $319 per square foot. 33 Michigan St is a home located in Hampden County with nearby schools including Hiram L. Dorman Elementary, John F. Kennedy Academy, and Springfield Central High School.
Ownership History
Date
Name
Owned For
Owner Type
Purchase Details
Closed on
Feb 4, 2021
Sold by
Moore Ellen T
Bought by
Berthiaume Christopher J
Current Estimated Value
Home Financials for this Owner
Home Financials are based on the most recent Mortgage that was taken out on this home.
Original Mortgage
$166,250
Outstanding Balance
$148,434
Interest Rate
2.6%
Mortgage Type
Purchase Money Mortgage
Estimated Equity
$150,764
Purchase Details
Closed on
Jun 19, 1996
Sold by
Autino Joseph M and Autino Anna M
Bought by
Lamprey Ellen T
Home Financials for this Owner
Home Financials are based on the most recent Mortgage that was taken out on this home.
Original Mortgage
$51,508
Interest Rate
8.21%
Mortgage Type
Purchase Money Mortgage
Create a Home Valuation Report for This Property
The Home Valuation Report is an in-depth analysis detailing your home's value as well as a comparison with similar homes in the area
Home Values in the Area
Average Home Value in this Area
Purchase History
| Date | Buyer | Sale Price | Title Company |
|---|---|---|---|
| Berthiaume Christopher J | $175,000 | None Available | |
| Lamprey Ellen T | $51,000 | -- |
Source: Public Records
Mortgage History
| Date | Status | Borrower | Loan Amount |
|---|---|---|---|
| Open | Berthiaume Christopher J | $166,250 | |
| Previous Owner | Lamprey Ellen T | $16,410 | |
| Previous Owner | Lamprey Ellen T | $16,400 | |
| Previous Owner | Lamprey Ellen T | $56,500 | |
| Previous Owner | Lamprey Ellen T | $51,508 |
Source: Public Records
Tax History Compared to Growth
Tax History
| Year | Tax Paid | Tax Assessment Tax Assessment Total Assessment is a certain percentage of the fair market value that is determined by local assessors to be the total taxable value of land and additions on the property. | Land | Improvement |
|---|---|---|---|---|
| 2025 | $3,699 | $235,900 | $45,000 | $190,900 |
| 2024 | $3,117 | $194,100 | $42,100 | $152,000 |
| 2023 | $3,236 | $189,800 | $34,500 | $155,300 |
| 2022 | $3,495 | $185,700 | $32,300 | $153,400 |
| 2021 | $3,266 | $172,800 | $29,300 | $143,500 |
| 2020 | $3,174 | $162,500 | $29,300 | $133,200 |
| 2019 | $2,680 | $136,200 | $30,400 | $105,800 |
| 2018 | $2,638 | $137,800 | $30,400 | $107,400 |
| 2017 | $2,613 | $132,900 | $25,800 | $107,100 |
| 2016 | $2,387 | $121,400 | $25,800 | $95,600 |
| 2015 | $2,262 | $115,000 | $25,800 | $89,200 |
Source: Public Records
Map
Nearby Homes
- 37 Champlain Ave
- 42 Geneva St
- 49 Mohegan Ave
- 108 Barre St
- 140 Cardinal St
- 98 Pine Grove St
- 97-99 Pine Grove St
- 34 Wallace St
- 0 Michon St
- 89 Pine Grove St
- 39 Wallace St
- 34 Temby St
- 320 Tremont St
- 70 Shumway St Unit 29
- 70 Shumway St Unit A1
- 19 Emily St
- 31 Wing St
- 543 Boston Rd
- 32 Better Way
- 25 Pioneer Way
- 43 Michigan St
- 34 Superior Ave
- 38 Superior Ave
- 21 Michigan St
- 44 Superior Ave
- 28 Superior Ave
- 47 Michigan St
- 17 Michigan St
- 38 Michigan St
- 48 Superior Ave
- 28 Michigan St
- 53 Michigan St
- 18 Superior Ave
- 24 Michigan St
- 48 Michigan St
- 83 Superior Ave (Ns)
- 18 Michigan St
- 14 Superior Ave
- 54 Michigan St
- 57 Michigan St Unit 59