
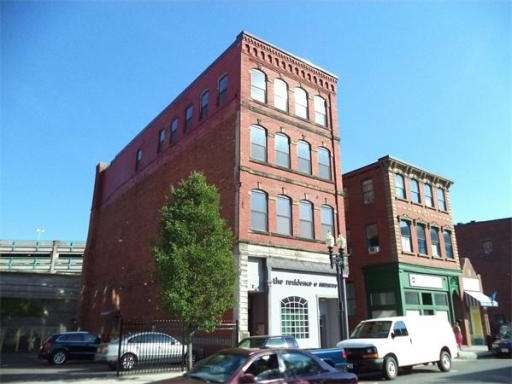
33 Munroe St Unit 1 Lynn, MA 01901
Downtown Lynn Neighborhood
1
Bed
1
Bath
1,294
Sq Ft
5,663
Sq Ft Lot
About This Home
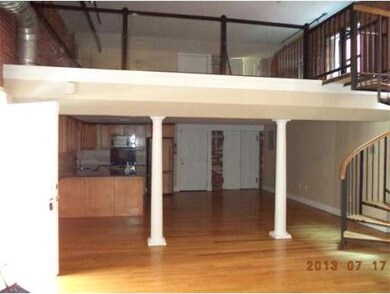
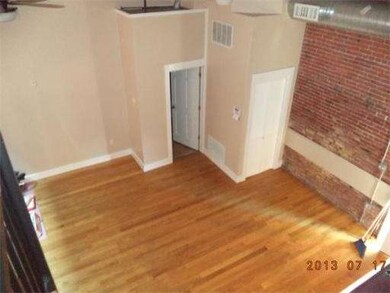
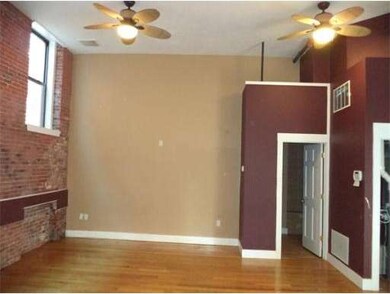
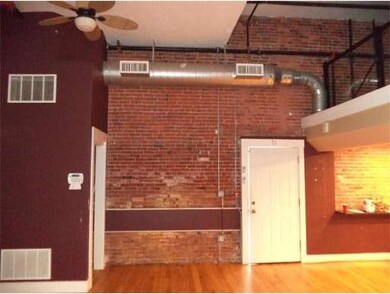
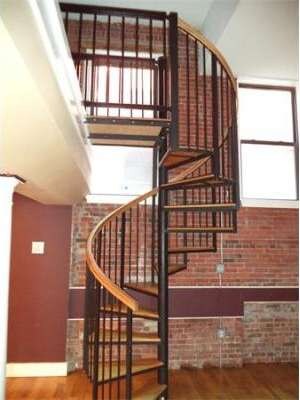
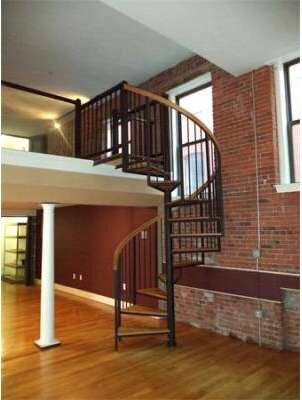
As of September 2024One of a kind unit in town unit. Freshly painted , hardwood floors, exposed brick ,granite counter tops and spiral staircase to additional space. Easy access to commuter rail and buses. Purchase for as little as 3% down. Seller requests ALL OFFERS BE SUBMITTED AT THEIR ONLINE SITE; SEE FIRM REMARKS AND DOCUMENT ATTACHED. No warranties or representations expressed or implied. Sold as is.
Property Details
Home Type
Condominium
Est. Annual Taxes
$3,814
Year Built
1900
Lot Details
0
Listing Details
- Unit Level: 1
- Special Features: 20
- Property Sub Type: Condos
- Year Built: 1900
Interior Features
- Has Basement: Yes
- Number of Rooms: 2
- Amenities: Public Transportation, Shopping, T-Station
- Electric: Circuit Breakers
- Kitchen: First Floor
- Living Room: First Floor
Exterior Features
- Exterior: Brick
Garage/Parking
- Parking Spaces: 1
Condo/Co-op/Association
- Association Fee Includes: Water, Sewer
- No Units: 4
- Unit Building: 1
Ownership History
Date
Name
Owned For
Owner Type
Purchase Details
Listed on
Oct 26, 2021
Closed on
Feb 9, 2022
Sold by
Marino Dawn M
Bought by
Palermo Nicole T and Rose Robert E
Seller's Agent
Marina Tramontozzi
True North Realty
Buyer's Agent
Marina Tramontozzi
True North Realty
Sold Price
$350,000
Current Estimated Value
Home Financials for this Owner
Home Financials are based on the most recent Mortgage that was taken out on this home.
Estimated Appreciation
$56,360
Avg. Annual Appreciation
4.46%
Original Mortgage
$297,500
Interest Rate
3.56%
Mortgage Type
Purchase Money Mortgage
Purchase Details
Listed on
May 29, 2018
Closed on
Jun 13, 2018
Sold by
Finocchio Bryan J
Bought by
Marino Dawn M
Seller's Agent
Marina Tramontozzi
True North Realty
Buyer's Agent
Marina Tramontozzi
True North Realty
Sold Price
$1,800
Home Financials for this Owner
Home Financials are based on the most recent Mortgage that was taken out on this home.
Avg. Annual Appreciation
6.81%
Original Mortgage
$216,000
Interest Rate
4.5%
Mortgage Type
New Conventional
Purchase Details
Listed on
Jul 24, 2013
Closed on
Jan 24, 2014
Sold by
Fnma
Bought by
Finocchio Bryan J
Seller's Agent
Elizabeth Wood
Tache Real Estate, Inc.
Buyer's Agent
Colleen Toner
Toner Real Estate, LLC
List Price
$139,900
Sold Price
$126,800
Premium/Discount to List
-$13,100
-9.36%
Home Financials for this Owner
Home Financials are based on the most recent Mortgage that was taken out on this home.
Avg. Annual Appreciation
19.29%
Original Mortgage
$121,125
Interest Rate
4%
Mortgage Type
New Conventional
Purchase Details
Closed on
Apr 23, 2013
Sold by
Gray Gregory A
Bought by
Federal National Mortgage Association
Purchase Details
Closed on
Jan 9, 2006
Sold by
Pace Anthony
Bought by
Gray Gregory A
Similar Home in Lynn, MA
Create a Home Valuation Report for This Property
The Home Valuation Report is an in-depth analysis detailing your home's value as well as a comparison with similar homes in the area
Home Values in the Area
Average Home Value in this Area
Purchase History
| Date | Type | Sale Price | Title Company |
|---|---|---|---|
| Not Resolvable | $350,000 | None Available | |
| Not Resolvable | $275,000 | -- | |
| Not Resolvable | $126,800 | -- | |
| Foreclosure Deed | $181,508 | -- | |
| Foreclosure Deed | $181,508 | -- | |
| Deed | $265,000 | -- | |
| Deed | $265,000 | -- |
Source: Public Records
Mortgage History
| Date | Status | Loan Amount | Loan Type |
|---|---|---|---|
| Open | $359,100 | Purchase Money Mortgage | |
| Closed | $359,100 | Purchase Money Mortgage | |
| Closed | $297,500 | Purchase Money Mortgage | |
| Previous Owner | $216,000 | New Conventional | |
| Previous Owner | $121,125 | New Conventional |
Source: Public Records
Property History
| Date | Event | Price | Change | Sq Ft Price |
|---|---|---|---|---|
| 09/13/2024 09/13/24 | Sold | $399,000 | -2.7% | $308 / Sq Ft |
| 08/04/2024 08/04/24 | Pending | -- | -- | -- |
| 06/26/2024 06/26/24 | For Sale | $410,000 | +17.1% | $317 / Sq Ft |
| 02/09/2022 02/09/22 | Sold | $350,000 | 0.0% | $270 / Sq Ft |
| 02/05/2022 02/05/22 | Pending | -- | -- | -- |
| 02/04/2022 02/04/22 | For Sale | -- | -- | -- |
| 11/23/2021 11/23/21 | Off Market | $350,000 | -- | -- |
| 10/26/2021 10/26/21 | For Sale | $359,000 | 0.0% | $277 / Sq Ft |
| 06/30/2018 06/30/18 | Rented | $1,800 | -99.3% | -- |
| 06/26/2018 06/26/18 | Under Contract | -- | -- | -- |
| 06/14/2018 06/14/18 | Sold | $275,000 | 0.0% | $213 / Sq Ft |
| 05/29/2018 05/29/18 | For Rent | $1,850 | 0.0% | -- |
| 05/02/2018 05/02/18 | Pending | -- | -- | -- |
| 04/25/2018 04/25/18 | For Sale | $279,900 | +120.7% | $216 / Sq Ft |
| 01/24/2014 01/24/14 | Sold | $126,800 | 0.0% | $98 / Sq Ft |
| 12/17/2013 12/17/13 | Off Market | $126,800 | -- | -- |
| 12/02/2013 12/02/13 | For Sale | $139,900 | +10.3% | $108 / Sq Ft |
| 11/29/2013 11/29/13 | Off Market | $126,800 | -- | -- |
| 11/27/2013 11/27/13 | Price Changed | $139,900 | -6.7% | $108 / Sq Ft |
| 10/31/2013 10/31/13 | Price Changed | $149,900 | -6.3% | $116 / Sq Ft |
| 10/15/2013 10/15/13 | Price Changed | $159,900 | -5.9% | $124 / Sq Ft |
| 09/15/2013 09/15/13 | Price Changed | $169,900 | -8.2% | $131 / Sq Ft |
| 08/14/2013 08/14/13 | For Sale | $185,000 | +45.9% | $143 / Sq Ft |
| 08/08/2013 08/08/13 | Off Market | $126,800 | -- | -- |
| 07/24/2013 07/24/13 | For Sale | $185,000 | -- | $143 / Sq Ft |
Source: MLS Property Information Network (MLS PIN)
Tax History Compared to Growth
Tax History
| Year | Tax Paid | Tax Assessment Tax Assessment Total Assessment is a certain percentage of the fair market value that is determined by local assessors to be the total taxable value of land and additions on the property. | Land | Improvement |
|---|---|---|---|---|
| 2025 | $3,814 | $368,100 | $0 | $368,100 |
| 2024 | $3,655 | $347,100 | $0 | $347,100 |
| 2023 | $3,275 | $293,700 | $0 | $293,700 |
| 2022 | $3,362 | $270,500 | $0 | $270,500 |
| 2021 | $3,426 | $262,900 | $0 | $262,900 |
| 2020 | $3,367 | $251,300 | $0 | $251,300 |
| 2019 | $3,648 | $255,100 | $0 | $255,100 |
| 2018 | $3,785 | $238,400 | $0 | $238,400 |
| 2017 | $3,510 | $225,000 | $0 | $225,000 |
| 2016 | $2,435 | $150,500 | $0 | $150,500 |
| 2015 | $2,419 | $144,400 | $0 | $144,400 |
Source: Public Records
Agents Affiliated with this Home
-
Kevin Dacey
Seller's Agent in 2024
Kevin Dacey
Dacey Realty, LLC
(617) 852-0383
1 in this area
29 Total Sales
-
Esther Summersett
Buyer's Agent in 2024
Esther Summersett
Hadassah Homes, Inc.
(781) 309-2010
2 in this area
23 Total Sales
-
Marina Tramontozzi
Seller's Agent in 2022
Marina Tramontozzi
True North Realty
(617) 291-8220
2 in this area
109 Total Sales
-
Soraya Cacici
Seller's Agent in 2018
Soraya Cacici
Nest Forward
(781) 572-8725
10 in this area
39 Total Sales
-
Betsy Williams
B
Seller Co-Listing Agent in 2018
Betsy Williams
Century 21 North East
(800) 844-7653
16 Total Sales
-
The Andover Team
T
Buyer's Agent in 2018
The Andover Team
True North Realty
(978) 664-1671
15 Total Sales
Map
Source: MLS Property Information Network (MLS PIN)
MLS Number: 71559564
APN: LYNN-000068-000627-000002-000002-000002
Disclaimer: Certain information contained herein is derived from information provided by parties other than Homes.com. All information provided is deemed reliable, but is not guaranteed to be accurate and should be independently verified.
![]() The property listing data and information, or the Images, set forth herein were provided to MLS Property Information Network, Inc. from third party sources, including sellers, lessors and public records, and were compiled by MLS Property Information Network, Inc. The property listing data and information, and the Images, are for the personal, non-commercial use of consumers having a good faith interest in purchasing or leasing listed properties of the type displayed to them and may not be used for any purpose other than to identify prospective properties which such consumers may have a good faith interest in purchasing or leasing. MLS Property Information Network, Inc. and its subscribers disclaim any and all representations and warranties as to the accuracy of the property listing data and information, or as to the accuracy of any of the Images, set forth herein.
The property listing data and information, or the Images, set forth herein were provided to MLS Property Information Network, Inc. from third party sources, including sellers, lessors and public records, and were compiled by MLS Property Information Network, Inc. The property listing data and information, and the Images, are for the personal, non-commercial use of consumers having a good faith interest in purchasing or leasing listed properties of the type displayed to them and may not be used for any purpose other than to identify prospective properties which such consumers may have a good faith interest in purchasing or leasing. MLS Property Information Network, Inc. and its subscribers disclaim any and all representations and warranties as to the accuracy of the property listing data and information, or as to the accuracy of any of the Images, set forth herein.
Nearby Homes
- 49 Munroe St Unit 201
- 49 Munroe St Unit 405
- 170 Oxford St Unit 402
- 170 Oxford St Unit 305
- 423-427 Union St
- 7 Central Square Unit 307
- 7 Central Square Unit 203
- 260-276 Lynnway
- 70 Exchange St Unit 205
- 589 Essex St Unit 303
- 589 Essex St Unit 405
- 19 High St
- 10 Pleasant St Unit 112
- 154 Lynnway Unit 309
- 154 Lynnway Unit 511
- 154 Lynnway Unit 509
- 39 Newhall St
- 150 Lynnway Unit 508
- 150 Lynnway Unit 406
- 57 Johnson St