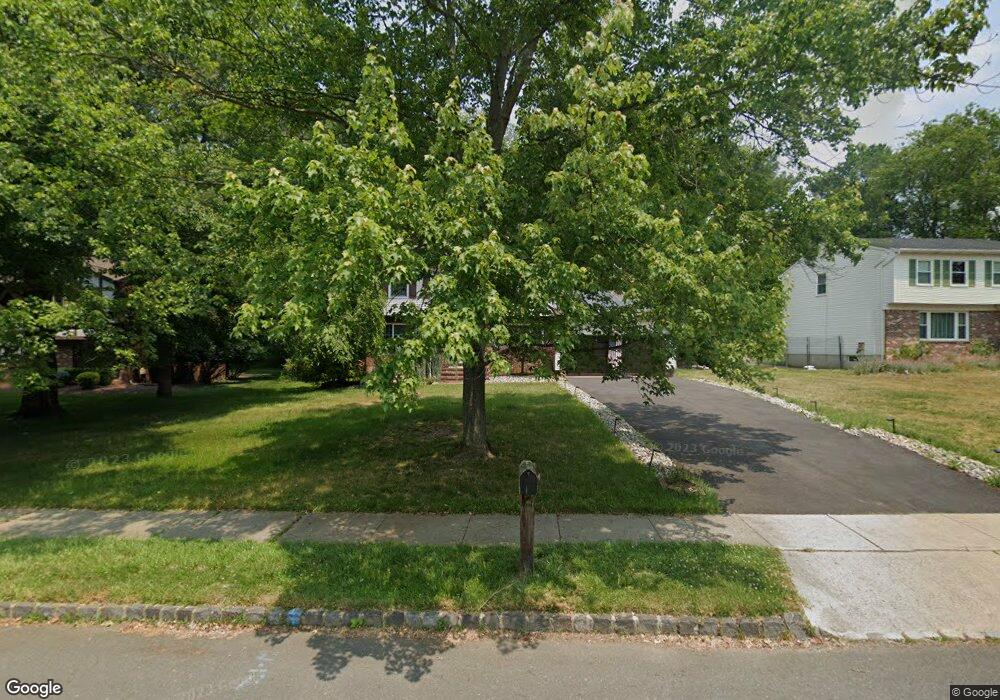
33 Tracy Dr Manalapan, NJ 07726
Estimated Value: $840,000 - $945,000
4
Beds
3
Baths
2,444
Sq Ft
$364/Sq Ft
Est. Value
About This Home
This home is located at 33 Tracy Dr, Manalapan, NJ 07726 and is currently estimated at $889,352, approximately $363 per square foot. 33 Tracy Dr is a home located in Monmouth County with nearby schools including Lafayette Mills Elementary School, Pine Brook Elementary School, and Manalapan-Englishtown Middle School.
Ownership History
Date
Name
Owned For
Owner Type
Purchase Details
Closed on
Jul 2, 2013
Sold by
Joniaux Carlos
Bought by
Joniaux Lisa M
Current Estimated Value
Purchase Details
Closed on
Dec 3, 2007
Sold by
Krause David and Krause Jessica
Bought by
Joniaux Carlos and Joniaux Lisa M
Home Financials for this Owner
Home Financials are based on the most recent Mortgage that was taken out on this home.
Original Mortgage
$50,800
Outstanding Balance
$41,676
Interest Rate
6.37%
Mortgage Type
Credit Line Revolving
Estimated Equity
$847,676
Purchase Details
Closed on
Dec 20, 2005
Sold by
Kenny Peter
Bought by
Krause David and Krause Jessica
Home Financials for this Owner
Home Financials are based on the most recent Mortgage that was taken out on this home.
Original Mortgage
$477,000
Interest Rate
2%
Mortgage Type
Adjustable Rate Mortgage/ARM
Create a Home Valuation Report for This Property
The Home Valuation Report is an in-depth analysis detailing your home's value as well as a comparison with similar homes in the area
Home Values in the Area
Average Home Value in this Area
Purchase History
| Date | Buyer | Sale Price | Title Company |
|---|---|---|---|
| Joniaux Lisa M | -- | None Available | |
| Joniaux Carlos | $508,000 | Coastal Title Agency Inc | |
| Krause David | $530,000 | -- |
Source: Public Records
Mortgage History
| Date | Status | Borrower | Loan Amount |
|---|---|---|---|
| Open | Joniaux Carlos | $50,800 | |
| Open | Joniaux Carlos | $406,400 | |
| Previous Owner | Krause David | $477,000 |
Source: Public Records
Tax History Compared to Growth
Tax History
| Year | Tax Paid | Tax Assessment Tax Assessment Total Assessment is a certain percentage of the fair market value that is determined by local assessors to be the total taxable value of land and additions on the property. | Land | Improvement |
|---|---|---|---|---|
| 2025 | $11,843 | $776,000 | $331,900 | $444,100 |
| 2024 | $11,525 | $701,600 | $319,900 | $381,700 |
| 2023 | $11,525 | $692,600 | $319,900 | $372,700 |
| 2022 | $10,548 | $612,800 | $257,900 | $354,900 |
| 2021 | $10,548 | $508,100 | $192,400 | $315,700 |
| 2020 | $10,150 | $494,400 | $152,400 | $342,000 |
| 2019 | $10,000 | $486,600 | $152,400 | $334,200 |
| 2018 | $9,944 | $481,100 | $162,400 | $318,700 |
| 2017 | $9,764 | $472,600 | $162,400 | $310,200 |
| 2016 | $9,722 | $476,100 | $169,900 | $306,200 |
| 2015 | $9,705 | $470,200 | $169,900 | $300,300 |
| 2014 | $9,455 | $446,000 | $152,400 | $293,600 |
Source: Public Records
Map
Nearby Homes
- 4 Terrace Dr
- 69 Caldwell Terrace
- 41 Longstreet Rd
- 39 Longstreet Rd
- 46 S Foxcroft Dr
- 34 Brookside Cir
- 41 Lakeview Dr
- 39 Homestead Cir
- 41 Livingston Ln
- 29 Coventry Terrace
- 26 Lansdale Dr
- 7 Bishop Ct
- 126 Wyncrest Rd
- 3 Sugar Maple Ave
- 9 Bennett Ct
- 62 Murray Hill Terrace
- 25 Highland Dr
- 102 Murray Hill Terrace
- 72 Murray Hill Terrace
- 10 Locust Grove Ln