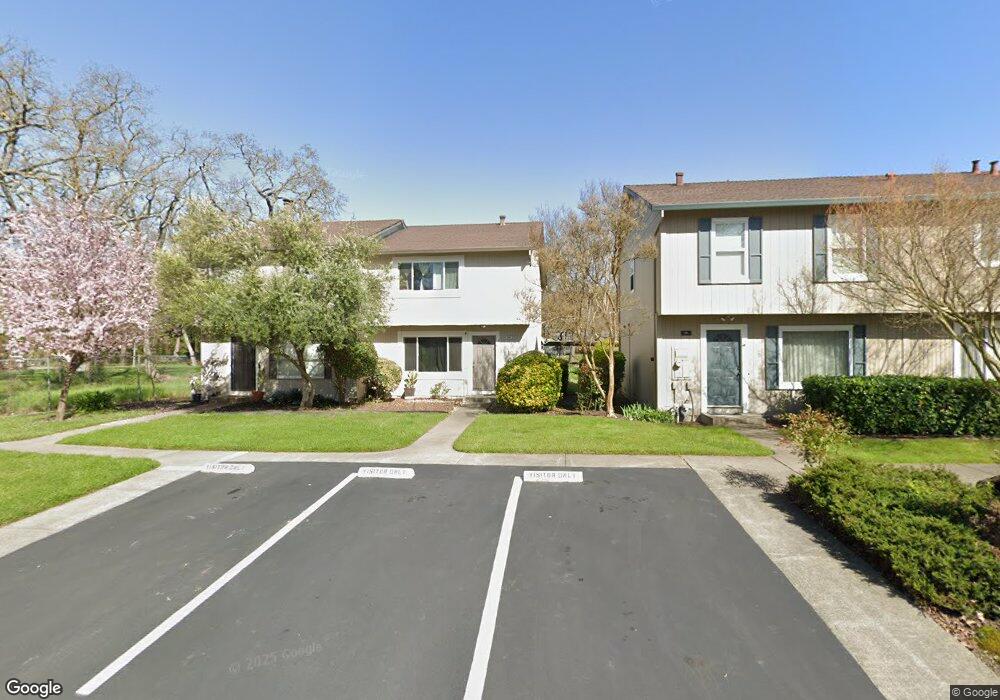
330 Algiers Ct Santa Rosa, CA 95409
Estimated Value: $415,000 - $514,000
3
Beds
2
Baths
1,200
Sq Ft
$397/Sq Ft
Est. Value
About This Home
This home is located at 330 Algiers Ct, Santa Rosa, CA 95409 and is currently estimated at $476,460, approximately $397 per square foot. 330 Algiers Ct is a home located in Sonoma County with nearby schools including Rincon Valley Middle School, Maria Carrillo High School, and Whited Elementary Charter School.
Ownership History
Date
Name
Owned For
Owner Type
Purchase Details
Closed on
Jun 11, 2014
Sold by
Morales Javier and Morales Maria Norma
Bought by
Zhong Zhi Hang
Current Estimated Value
Purchase Details
Closed on
Mar 19, 2005
Sold by
Lopez Margarito and Lopez Emelia
Bought by
Lopez Margarito and Lopez Emelia
Purchase Details
Closed on
Dec 10, 2002
Sold by
Batchelder Paul E and Batchelder Patricia E
Bought by
Morales Javier and Morales Maria Norma
Home Financials for this Owner
Home Financials are based on the most recent Mortgage that was taken out on this home.
Original Mortgage
$210,105
Interest Rate
6.03%
Purchase Details
Closed on
Mar 31, 1995
Sold by
Batchelder Paul E
Bought by
Batchelder Paul E and Batchelder Patricia E
Create a Home Valuation Report for This Property
The Home Valuation Report is an in-depth analysis detailing your home's value as well as a comparison with similar homes in the area
Home Values in the Area
Average Home Value in this Area
Purchase History
| Date | Buyer | Sale Price | Title Company |
|---|---|---|---|
| Zhong Zhi Hang | $205,000 | Fidelity National Title Co | |
| Lopez Margarito | $86,000 | -- | |
| Morales Javier | $232,000 | New Century Title Co | |
| Batchelder Paul E | -- | -- |
Source: Public Records
Mortgage History
| Date | Status | Borrower | Loan Amount |
|---|---|---|---|
| Previous Owner | Morales Javier | $210,105 | |
| Closed | Morales Javier | $25,000 |
Source: Public Records
Tax History Compared to Growth
Tax History
| Year | Tax Paid | Tax Assessment Tax Assessment Total Assessment is a certain percentage of the fair market value that is determined by local assessors to be the total taxable value of land and additions on the property. | Land | Improvement |
|---|---|---|---|---|
| 2025 | $3,002 | $251,291 | $79,676 | $171,615 |
| 2024 | $3,002 | $246,364 | $78,114 | $168,250 |
| 2023 | $3,002 | $241,534 | $76,583 | $164,951 |
| 2022 | $2,775 | $236,799 | $75,082 | $161,717 |
| 2021 | $2,720 | $232,157 | $73,610 | $158,547 |
| 2020 | $2,711 | $229,778 | $72,856 | $156,922 |
| 2019 | $2,685 | $225,274 | $71,428 | $153,846 |
| 2018 | $2,668 | $220,858 | $70,028 | $150,830 |
| 2017 | $2,620 | $216,528 | $68,655 | $147,873 |
| 2016 | $2,585 | $212,283 | $67,309 | $144,974 |
| 2015 | $2,508 | $209,095 | $66,298 | $142,797 |
| 2014 | $2,655 | $226,000 | $49,000 | $177,000 |
Source: Public Records
Map
Nearby Homes
- 311 Algiers Ct
- 5015 Charmian Dr
- 305 Simone Place N
- 5020 Roma St
- 5086 Charmian Dr
- 537 Emerald Park Ct
- 66 Coronado Cir
- 61 Coronado Cir
- 206 Indian Creek Dr
- 164 Brookview Ct
- 103 Glenoak Ct
- 5209 San Luis Ave
- 29 Coronado Cir
- 71 Oakcreek Ct
- 4705 Culebra Way
- 52 Oakstone Ct Unit 52
- 4704 Venti Ln
- 48 Shadyleaf Ct
- 5088 Firestone Ct
- 31 Springhill Ct
- 332 Algiers Ct
- 328 Algiers Ct
- 326 Algiers Ct
- 324 Algiers Ct
- 329 Algiers Ct
- 325 Algiers Ct
- 322 Algiers Ct
- 327 Algiers Ct
- 320 Algiers Ct
- 323 Algiers Ct
- 333 Algiers Ct
- 318 Algiers Ct
- 335 Algiers Ct
- 337 Algiers Ct
- 339 Algiers Ct
- 321 Algiers Ct
- 319 Algiers Ct
- 317 Algiers Ct
- 308 Algiers Ct
- 5000 Tunisia Ave