NOT LISTED FOR SALE

330 Bowles Rd Newbury, NH 03255

Estimated Value: $1,307,000 - $1,809,000

2 Beds
1.5 Baths
1,248 Sq Ft
$1,281/Sq Ft Est. Value

Last Sold August 29, 2017

Last sale price $475,000 $381 Per Sq Ft

Est. 236% increase in value since last sale

Current estimated payment $9,515/month

56 Days on Market

Highlights

  • 22 Feet of Waterfront
  • Level Lot
  • Wood Siding
  • Cottage

About This Home

As of August 2017

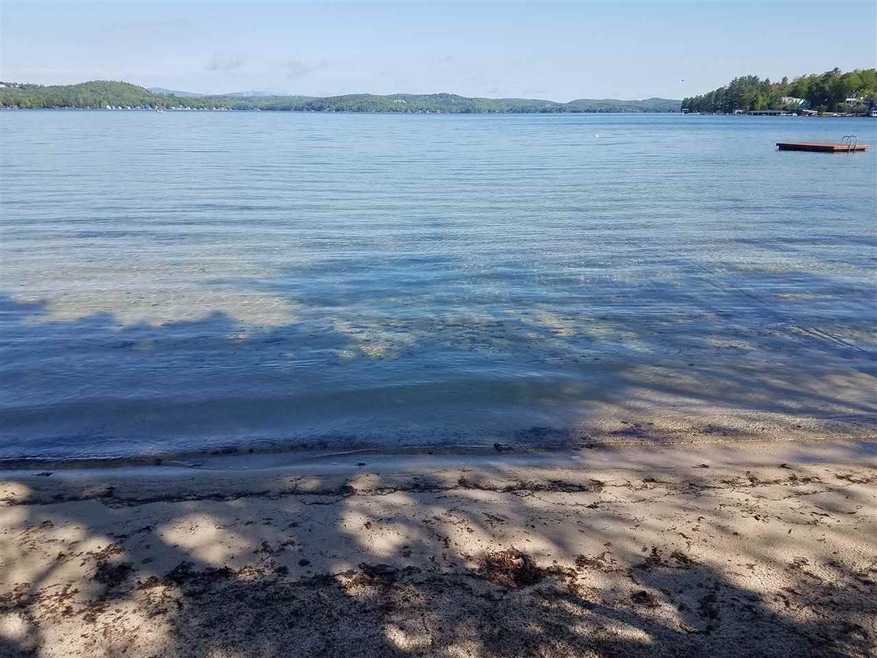
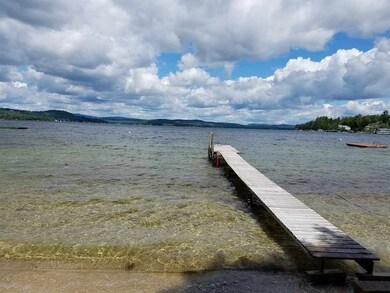
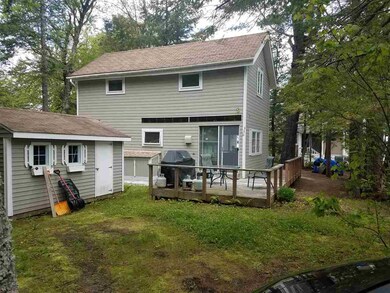
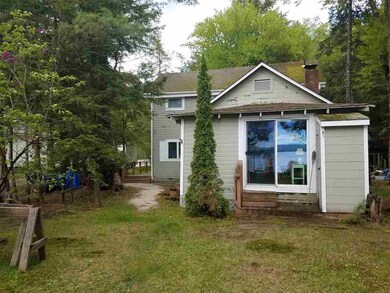
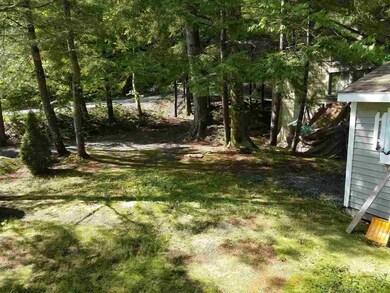
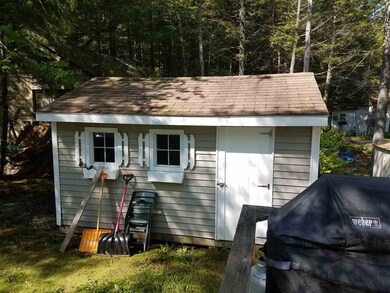
Where memories are made! This three season cottage loaded with charm, located on a pristine gentle walk-in sandy beach. Perfect for young children! Enjoy picturesque sunsets on the beach, quiet times with family and friends on the back deck. Property has a seasonal dock with mooring, outbuilding for bikes and other toys. Located only minutes to shopping, restaurants and Sunapee State Park.

Last Agent to Sell the Property

Edward Lassonde

Home Key Realty, LLC License #050159 Listed on: 06/06/2017

Last Buyer's Agent

Edward Lassonde

Home Key Realty, LLC License #050159 Listed on: 06/06/2017

Home Details

Home Type

  • Single Family

Est. Annual Taxes

  • $8,752

Year Built

  • Built in 1940

Lot Details

  • 8,712 Sq Ft Lot
  • 22 Feet of Waterfront
  • Lake Front
  • Level Lot

Parking

  • Gravel Driveway

Home Design

  • Cottage
  • Pillar, Post or Pier Foundation
  • Wood Frame Construction
  • Shingle Roof
  • Wood Siding

Interior Spaces

  • 1,248 Sq Ft Home
  • 2-Story Property
  • Stove

Bedrooms and Bathrooms

  • 2 Bedrooms

Outdoor Features

  • Water Access

Utilities

  • Heating System Uses Gas
  • Private Water Source
  • Electric Water Heater
  • Community Sewer or Septic

Listing and Financial Details

  • Legal Lot and Block 233 / 333

Home Details

Home Type

Single Family

Est. Annual Taxes

$8,752

Year Built

Built in 1940

Lot Details

0

Listing Details

  • Status Detail: Closed
  • Style: Cottage/Camp
  • Directions: From RTE. 89 North Exit 11, turn left onto King Hill Road, Left onto RTE 103 A, Right onto Blodgett Landing Road, Left onto Bowles Road, Property # 330 on Right.
  • Flood Zone: Unknown
  • Construction: Existing
  • Seasonal: Yes
  • Total Stories: 2
  • Price Per Sq Ft: 380.61
  • Property Class: Residential
  • Property Type: Single Family
  • Year Built: 1940
  • List Agent: 23118
  • Special Features: None
  • Property Sub Type: Detached
  • Stories: 2

Interior Features

  • Total Bedrooms: 2
  • Total Bathrooms: 2
  • Half Bathrooms: 1
  • Full Bathrooms: 1
  • Sq Ft - Apx Finished AG: 1248
  • Sq Ft - Apx Total: 1248
  • Sq Ft - Apx Total Finished: 1248

Exterior Features

  • Construction: Wood Frame
  • Driveway: Gravel
  • Exterior: Wood Siding
  • Foundation: Post/Piers
  • Road Frontage: Yes
  • Roads: Public
  • Roof: Shingle - Asphalt
  • Water Body Access: Yes
  • Water Body Name: Sunapee
  • Water Body Type: Lake
  • Water Frontage Length: 22
  • Water Body Access: Owned
  • Waterfront: Yes

Utilities

  • Electric: Circuit Breaker(s)
  • Sewer: Community
  • Water: Private
  • Water Heater: Electric
  • Heating Fuel: Gas - LP/Bottle
  • Heating: Alternative Heat Stove

Lot Info

  • Map: 016
  • Lot: 233
  • Lot Sq Ft: 8712
  • Lot Acres: 0.2
  • Lot Description: Lake Frontage, Level, Waterfront
  • Surveyed: Yes
  • Zoning: RES
  • Deed Book: 1866
  • Deed Page: 1896
  • Deed Recorded Type: Quit Claim

Tax Info

  • Tax Gross Amount: 8752
  • Tax Year: 2016

Range of Values:

--
Value Increase
--
Percent Increase
--
Adjusted for Inflation
Collateral Analytics

Collateral Analytics Collateral Analytics AVMs (Automated Valuation Model) employ a number of statistical approaches combined with neighborhood-specific comparable selection guarantees the most up-to-date and precise valuations.

Not Available

Collateral Analytics does not have data for the current month. Please view the chart for historical values.

ICE

ICE Mortgage Technology ICE Mortgage Technology’s AVM (Automated Valuation Model) is a state-of-the-art online residential property valuation tool that provides a quick and accurate estimate of the value of almost any home in the U.S.

Not Available

ICE Mortgage Technology does not have data for the current month. Please view the chart for historical values.

First American

First American First American Data & Analytics’ next-generation AVM combines unrivaled data assets with a blended ensemble of valuation models to produce highly accurate, reliable valuations you can trust.

Not Available

First American does not have data for the current month. Please view the chart for historical values.

Quantarium

Quantarium Quantarium’s valuation service, repeatedly proven the industry’s most accurate and comprehensive, is supercharged with a self-learning and auto-tuning AI engine that continually becomes smarter and more accurate as it processes daily inputs from the industry’s leading RE data lake.

Not Available

Quantarium does not have data for the current month. Please view the chart for historical values.

Average Value
Not Available
List Price
Sold Price
Create a Home Valuation Report for This Property
The Home Valuation Report is an in-depth analysis detailing your home's value as well as a comparison with similar homes in the area

Home Values in the Area

Source: Public Records

Average Home Value in this Area


Source: Public Records

Property History

Date Event Price List to Sale Price per Sq Ft
08/29/2017 08/29/17 Sold $475,000 -13.5% $381 / Sq Ft
08/01/2017 08/01/17 Pending -- -- --
06/06/2017 06/06/17 For Sale $549,000 -- $440 / Sq Ft
Source: PrimeMLS

Tax History Compared to Growth

Source: Public Records

Tax History

Year Tax Paid Tax Assessment Tax Assessment Total Assessment is a certain percentage of the fair market value that is determined by local assessors to be the total taxable value of land and additions on the property. Land Improvement
2024 $13,610 $1,042,900 $537,800 $505,100
2023 $13,610 $1,042,900 $537,800 $505,100
2022 $11,868 $1,042,900 $537,800 $505,100
2021 $11,868 $1,042,900 $537,800 $505,100
2020 $15,369 $930,300 $540,200 $390,100
2019 $11,900 $749,400 $540,200 $209,200
2018 $8,317 $536,600 $486,200 $50,400
2017 $8,430 $536,600 $486,200 $50,400
2016 $8,612 $536,600 $486,200 $50,400
2015 $8,332 $511,800 $461,000 $50,800
2014 $7,928 $511,800 $461,000 $50,800
2013 $7,641 $511,800 $461,000 $50,800
Source: Public Records

Agents Affiliated with this Home

  • Section Image
See All Agents

Map

Source: PrimeMLS

MLS Number: 4639269

PrimeMLS

APN: NWBU-000016-000333-000233