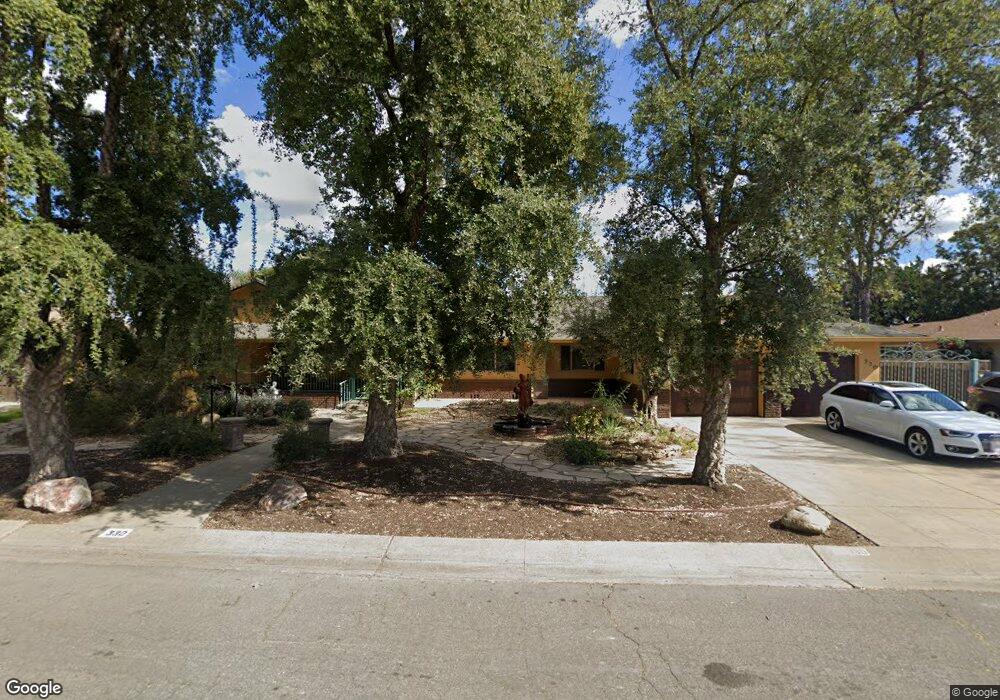
330 Kristmont St Lodi, CA 95242
Sunwest NeighborhoodEstimated Value: $476,000 - $756,565
4
Beds
3
Baths
3,158
Sq Ft
$217/Sq Ft
Est. Value
About This Home
This home is located at 330 Kristmont St, Lodi, CA 95242 and is currently estimated at $684,641, approximately $216 per square foot. 330 Kristmont St is a home located in San Joaquin County with nearby schools including Vinewood Elementary School, Millswood Middle School, and Lodi High School.
Ownership History
Date
Name
Owned For
Owner Type
Purchase Details
Closed on
Jun 29, 2007
Sold by
Miller Jennifer L
Bought by
Laviola Steven D and Miller Jennifer L
Current Estimated Value
Home Financials for this Owner
Home Financials are based on the most recent Mortgage that was taken out on this home.
Original Mortgage
$95,709
Interest Rate
6.41%
Mortgage Type
Credit Line Revolving
Purchase Details
Closed on
Jul 15, 2004
Sold by
Miller Jennifer L
Bought by
Miller Jennifer L
Home Financials for this Owner
Home Financials are based on the most recent Mortgage that was taken out on this home.
Original Mortgage
$410,000
Interest Rate
6.27%
Mortgage Type
New Conventional
Purchase Details
Closed on
Oct 4, 2001
Sold by
Maple Louise Silva
Bought by
Silva Manuel J and Maple Louise Silva
Purchase Details
Closed on
Sep 28, 2001
Sold by
Maple Louise S and Estate Of Annie I Silva
Bought by
Maple Louise S and Maple Manuel E
Purchase Details
Closed on
Aug 11, 2000
Sold by
Maple Louise Silva and Revocable Trust Of Manuel E &
Bought by
Maple Louise Silva
Purchase Details
Closed on
Jan 27, 1999
Sold by
Maple Louise Silva and Estate Of Annie I Silva
Bought by
Manuel E & Annie I Silva Family Trust
Create a Home Valuation Report for This Property
The Home Valuation Report is an in-depth analysis detailing your home's value as well as a comparison with similar homes in the area
Home Values in the Area
Average Home Value in this Area
Purchase History
| Date | Buyer | Sale Price | Title Company |
|---|---|---|---|
| Laviola Steven D | -- | Custom Title Solutions | |
| Miller Jennifer L | -- | Fidelity National | |
| Silva Manuel J | -- | -- | |
| Maple Louise S | -- | -- | |
| Maple Louise Silva | -- | -- | |
| Manuel E & Annie I Silva Family Trust | -- | -- |
Source: Public Records
Mortgage History
| Date | Status | Borrower | Loan Amount |
|---|---|---|---|
| Previous Owner | Laviola Steven D | $95,709 | |
| Previous Owner | Miller Jennifer L | $410,000 |
Source: Public Records
Tax History Compared to Growth
Tax History
| Year | Tax Paid | Tax Assessment Tax Assessment Total Assessment is a certain percentage of the fair market value that is determined by local assessors to be the total taxable value of land and additions on the property. | Land | Improvement |
|---|---|---|---|---|
| 2025 | $5,450 | $509,640 | $152,152 | $357,488 |
| 2024 | $5,299 | $499,648 | $149,169 | $350,479 |
| 2023 | $5,237 | $489,852 | $146,245 | $343,607 |
| 2022 | $5,119 | $480,248 | $143,378 | $336,870 |
| 2021 | $5,210 | $470,832 | $140,567 | $330,265 |
| 2020 | $5,074 | $466,005 | $139,126 | $326,879 |
| 2019 | $4,970 | $456,869 | $136,399 | $320,470 |
| 2018 | $4,899 | $447,912 | $133,725 | $314,187 |
| 2017 | $4,789 | $439,130 | $131,103 | $308,027 |
| 2016 | $4,487 | $430,522 | $128,533 | $301,989 |
| 2014 | $4,376 | $415,752 | $124,123 | $291,629 |
Source: Public Records
Map
Nearby Homes
- 2379 Hyde Park Cir
- 208 Gramercy Park Dr
- 2438 Central Park Dr
- 2495 Macarthur Pkwy
- 2132 Tracy Place
- 306 Shady Acres Dr
- 2438 W Tokay St
- 2145 W Pine St
- 2585 Buttercup Dr
- 1818 Capell Dr
- 835 Kramer Dr
- 2131 Jerry Ln
- 872 Westwind Dr
- 2001 Jerry Ln
- 19 N Pinewood Ct
- 2965 Cammie Ln
- 2161 W Elm St
- 2025 W Vine St
- 2432 W Vine St
- 2651 Douglas Fir Dr
- 340 Kristmont St
- 320 Kristmont St
- 335 Bella Vista Dr
- 343 Bella Vista Dr
- 327 Bella Vista Dr
- 331 Kristmont St
- 341 Kristmont St
- 346 Kristmont St
- 351 Bella Vista Dr
- 315 Bella Vista Dr
- 321 Kristmont St
- 310 Kristmont St
- 350 Kristmont St
- 2301 Cabrillo Cir
- 2231 Cabrillo Cir
- 334 La Vida Dr
- 311 Kristmont St
- 334 Bella Vista Dr
- 305 Bella Vista Dr
- 344 La Vida Dr