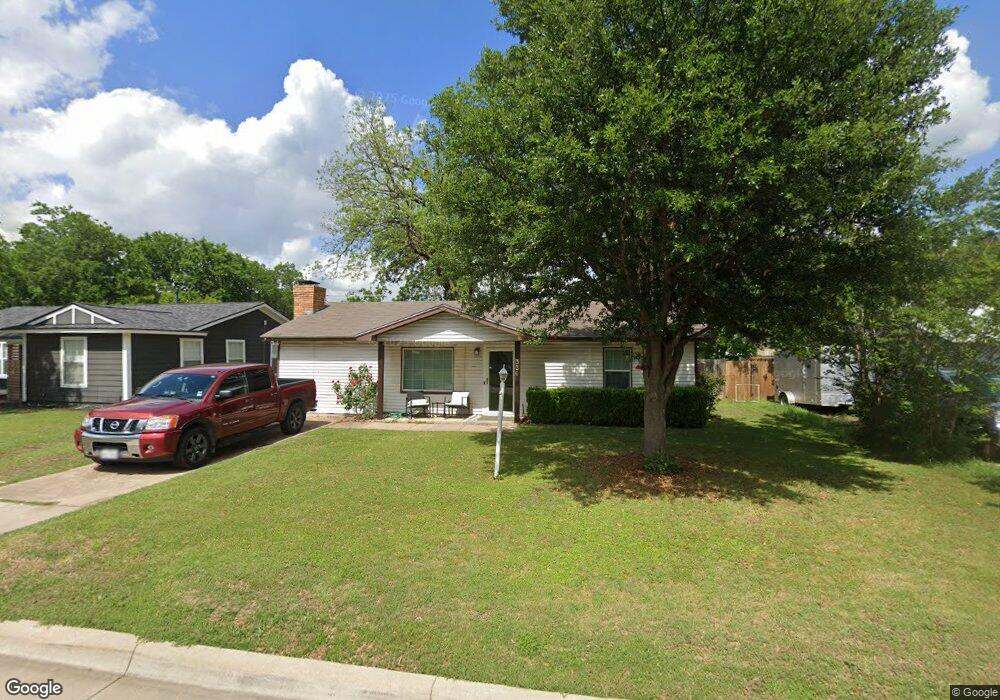
330 NW Lorna St Burleson, TX 76028
Estimated Value: $227,000 - $251,000
3
Beds
1
Bath
1,320
Sq Ft
$181/Sq Ft
Est. Value
About This Home
This home is located at 330 NW Lorna St, Burleson, TX 76028 and is currently estimated at $238,976, approximately $181 per square foot. 330 NW Lorna St is a home located in Johnson County with nearby schools including Jack Taylor Elementary School, Hughes Middle School, and Burleson High School.
Ownership History
Date
Name
Owned For
Owner Type
Purchase Details
Closed on
Jun 14, 2020
Sold by
Currey Wanda Michelle
Bought by
Currey John Roy
Current Estimated Value
Purchase Details
Closed on
Feb 24, 2005
Sold by
Shafer Tina L
Bought by
Currey John R and Currey Wanda M
Home Financials for this Owner
Home Financials are based on the most recent Mortgage that was taken out on this home.
Original Mortgage
$73,841
Outstanding Balance
$37,433
Interest Rate
5.71%
Mortgage Type
FHA
Estimated Equity
$201,543
Create a Home Valuation Report for This Property
The Home Valuation Report is an in-depth analysis detailing your home's value as well as a comparison with similar homes in the area
Home Values in the Area
Average Home Value in this Area
Purchase History
| Date | Buyer | Sale Price | Title Company |
|---|---|---|---|
| Currey John Roy | -- | None Available | |
| Currey John R | -- | Fatco |
Source: Public Records
Mortgage History
| Date | Status | Borrower | Loan Amount |
|---|---|---|---|
| Open | Currey John R | $73,841 |
Source: Public Records
Tax History Compared to Growth
Tax History
| Year | Tax Paid | Tax Assessment Tax Assessment Total Assessment is a certain percentage of the fair market value that is determined by local assessors to be the total taxable value of land and additions on the property. | Land | Improvement |
|---|---|---|---|---|
| 2025 | $2,025 | $238,476 | $46,000 | $192,476 |
| 2024 | $3,342 | $145,487 | $0 | $0 |
| 2023 | $1,699 | $196,593 | $35,000 | $161,593 |
| 2022 | $3,024 | $196,593 | $35,000 | $161,593 |
| 2021 | $2,843 | $142,235 | $25,000 | $117,235 |
| 2020 | $2,696 | $147,937 | $25,000 | $122,937 |
| 2019 | $2,599 | $145,403 | $25,000 | $120,403 |
| 2018 | $2,363 | $135,655 | $25,000 | $110,655 |
| 2017 | $2,042 | $98,400 | $18,000 | $80,400 |
| 2016 | $1,856 | $86,218 | $16,000 | $70,218 |
| 2015 | $1,346 | $61,700 | $16,000 | $45,700 |
| 2014 | $1,346 | $69,765 | $16,000 | $53,765 |
Source: Public Records
Map
Nearby Homes
- 124 NE Anderson St
- 102 NE Murphy Rd
- 103 NE Murphy Rd
- 213 NE Murphy Rd
- 509 NW Renfro St
- 408 NW Douglas St
- 200 SW Thomas St
- 541 NW Lorna St
- 200 SW Moody St
- 246 NE Amy St
- 556 NW Hillery St
- 400 Piccadilly Cir
- 419 Murphy Rd
- 216 NE Cindy Ln
- 219 SW Murphy Rd
- 345 N Field St
- 353 N Field St
- 609 NW Douglas St
- 157 SE Tarrant Ave
- 229 S Wilson St
- 324 NW Lorna St
- 338 NW Lorna St
- 320 NW Lorna St
- 342 NW Lorna St
- 329 NW Lorna St
- 325 NW Lorna St
- 337 NW Lorna St
- 321 NW Lorna St
- 341 NW Lorna St
- 346 NW Lorna St
- 345 NW Lorna St
- 355 NW Hillery St
- 350 NW Lorna St
- 328 NW King St
- 332 NW King St
- 349 NW Lorna St
- 324 NW King St
- 336 NW King St
- 320 NW King St
- 340 NW King St