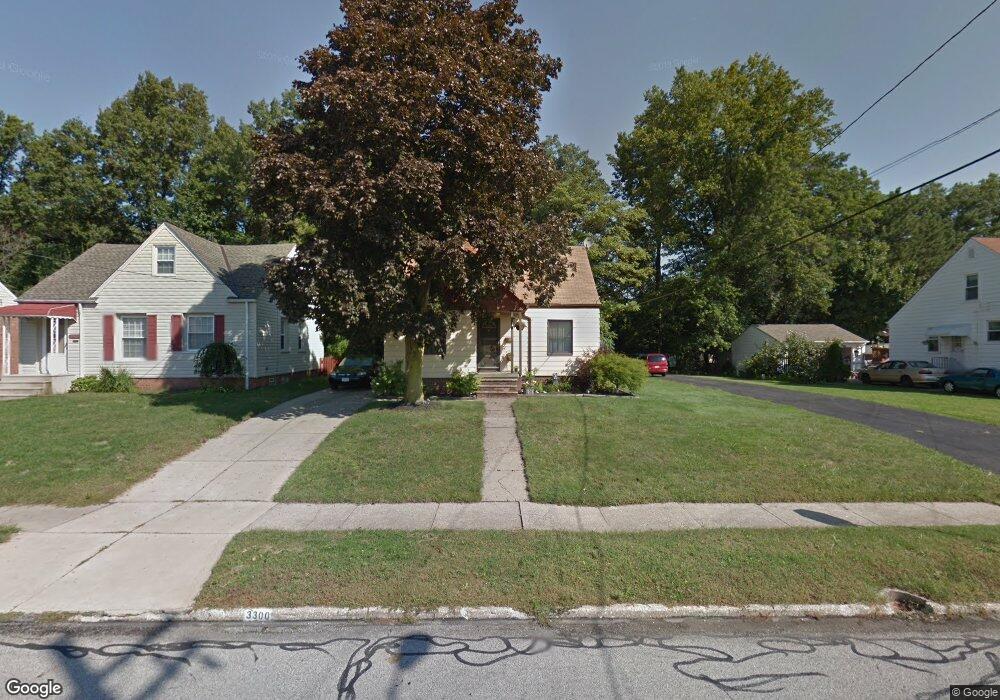
3300 Hearthstone Rd Cleveland, OH 44134
Estimated Value: $173,000 - $202,000
2
Beds
1
Bath
1,159
Sq Ft
$162/Sq Ft
Est. Value
About This Home
This home is located at 3300 Hearthstone Rd, Cleveland, OH 44134 and is currently estimated at $187,561, approximately $161 per square foot. 3300 Hearthstone Rd is a home located in Cuyahoga County with nearby schools including John Muir Elementary School, Shiloh Middle School, and Parma High School.
Ownership History
Date
Name
Owned For
Owner Type
Purchase Details
Closed on
Jan 13, 2016
Sold by
Estate Of Deborah A Bane
Bought by
Bane William C
Current Estimated Value
Purchase Details
Closed on
Feb 27, 1997
Sold by
Mackulin Lisa M
Bought by
Bane Deborah A and Bane William C
Home Financials for this Owner
Home Financials are based on the most recent Mortgage that was taken out on this home.
Original Mortgage
$75,000
Interest Rate
7.93%
Mortgage Type
New Conventional
Purchase Details
Closed on
Dec 13, 1991
Sold by
Ellis Mark S
Bought by
Mackulin Alan H
Purchase Details
Closed on
Oct 21, 1988
Sold by
Ellis Deborah and Ellis Mark S
Bought by
Ellis Mark S
Purchase Details
Closed on
Jun 13, 1984
Sold by
Ellis Peter J
Bought by
Ellis Deborah and Ellis Mark S
Purchase Details
Closed on
Jul 11, 1980
Sold by
Ellis Minnie
Bought by
Ellis Peter J
Purchase Details
Closed on
Jan 1, 1975
Bought by
Ellis Minnie
Create a Home Valuation Report for This Property
The Home Valuation Report is an in-depth analysis detailing your home's value as well as a comparison with similar homes in the area
Home Values in the Area
Average Home Value in this Area
Purchase History
| Date | Buyer | Sale Price | Title Company |
|---|---|---|---|
| Bane William C | -- | None Available | |
| Bane Deborah A | $95,000 | -- | |
| Mackulin Alan H | $76,000 | -- | |
| Ellis Mark S | -- | -- | |
| Ellis Deborah | $30,000 | -- | |
| Ellis Peter J | -- | -- | |
| Ellis Minnie | -- | -- |
Source: Public Records
Mortgage History
| Date | Status | Borrower | Loan Amount |
|---|---|---|---|
| Previous Owner | Bane Deborah A | $75,000 |
Source: Public Records
Tax History Compared to Growth
Tax History
| Year | Tax Paid | Tax Assessment Tax Assessment Total Assessment is a certain percentage of the fair market value that is determined by local assessors to be the total taxable value of land and additions on the property. | Land | Improvement |
|---|---|---|---|---|
| 2024 | $3,334 | $54,250 | $10,570 | $43,680 |
| 2023 | $2,836 | $39,410 | $9,240 | $30,170 |
| 2022 | $2,809 | $39,410 | $9,240 | $30,170 |
| 2021 | $2,888 | $39,410 | $9,240 | $30,170 |
| 2020 | $2,533 | $30,310 | $7,110 | $23,210 |
| 2019 | $2,422 | $86,600 | $20,300 | $66,300 |
| 2018 | $2,283 | $30,310 | $7,110 | $23,210 |
| 2017 | $2,291 | $26,500 | $5,010 | $21,490 |
| 2016 | $2,277 | $26,500 | $5,010 | $21,490 |
| 2015 | $2,130 | $26,500 | $5,010 | $21,490 |
| 2014 | $2,163 | $27,020 | $5,110 | $21,910 |
Source: Public Records
Map
Nearby Homes
- 3104 Liggett Dr
- 3019 Torrington Ave
- 2907 Liggett Dr
- 3910 Wood Ave
- 4005 Pershing Ave
- 4000 Pershing Ave
- 2923 Brookdale Ave
- 5432 State Rd
- 5850 S Park Blvd
- 4409 Milford Ave
- 2503 Brookdale Ave
- 4420 Torrington Ave
- 3436 Heresford Dr
- 3714 Russell Ave
- 4424 Forestwood Dr
- 3323 North Ave
- 4323 Russell Ave
- 2821 Parklane Dr
- 2302 Brookdale Ave
- 3402 North Ave
- 3302 Hearthstone Rd
- 3210 Hearthstone Rd
- 3306 Hearthstone Rd
- 3206 Hearthstone Rd
- 3312 Hearthstone Rd
- 3202 Hearthstone Rd
- 3303 Hearthstone Rd
- 3215 Hearthstone Rd
- 3307 Hearthstone Rd
- 3211 Hearthstone Rd
- 3120 Hearthstone Rd
- 3311 Hearthstone Rd
- 3207 Hearthstone Rd
- 3313 Hearthstone Rd
- 3203 Hearthstone Rd
- 3324 Hearthstone Rd
- 3116 Hearthstone Rd
- 3317 Hearthstone Rd
- 3121 Hearthstone Rd
- 3112 Hearthstone Rd