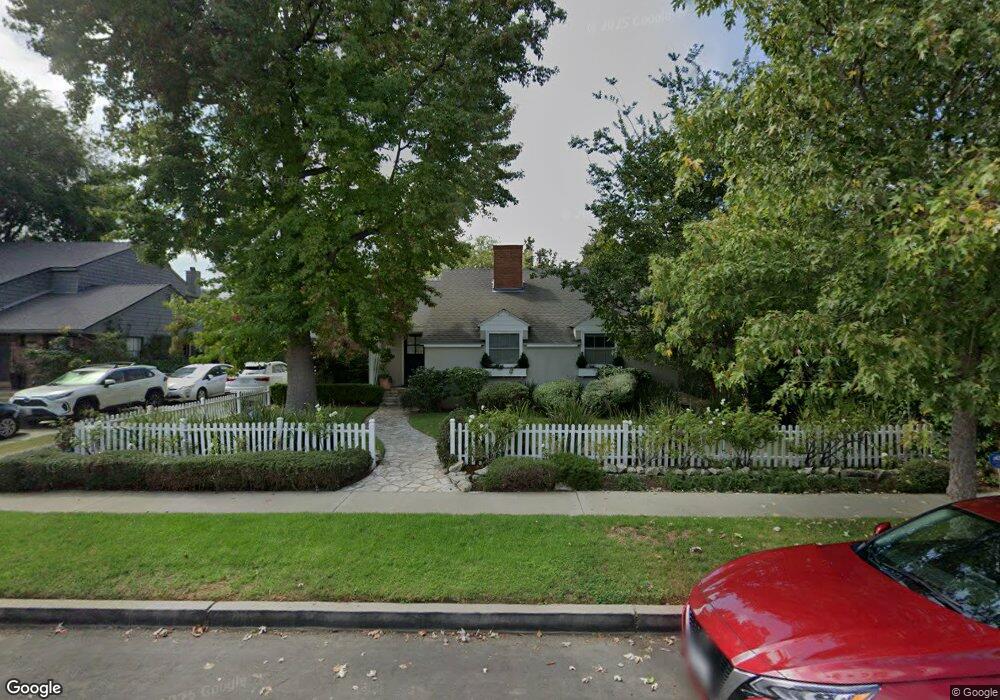
3303 Coolidge Ave Los Angeles, CA 90066
Mar Vista NeighborhoodEstimated Value: $2,299,701 - $2,838,000
3
Beds
2
Baths
1,820
Sq Ft
$1,432/Sq Ft
Est. Value
About This Home
This home is located at 3303 Coolidge Ave, Los Angeles, CA 90066 and is currently estimated at $2,606,675, approximately $1,432 per square foot. 3303 Coolidge Ave is a home located in Los Angeles County with nearby schools including Mar Vista Elementary, Daniel Webster Middle School, and Venice High School.
Ownership History
Date
Name
Owned For
Owner Type
Purchase Details
Closed on
Apr 4, 2025
Sold by
Wong Stevan F and Wheeler Joellen
Bought by
Wong Wheeler Family Trust and Wong
Current Estimated Value
Purchase Details
Closed on
Feb 3, 2010
Sold by
Wheeler Joellen
Bought by
Wong Stevan F and Wheeler Joellen
Home Financials for this Owner
Home Financials are based on the most recent Mortgage that was taken out on this home.
Original Mortgage
$415,000
Interest Rate
5.11%
Mortgage Type
New Conventional
Purchase Details
Closed on
May 8, 1997
Sold by
Norby Kristin C
Bought by
Wheeler Joellen
Home Financials for this Owner
Home Financials are based on the most recent Mortgage that was taken out on this home.
Original Mortgage
$400,000
Interest Rate
7.62%
Purchase Details
Closed on
Jul 24, 1996
Sold by
Norby Kristin C
Bought by
Norby Kristin C and Kristin C Norby 1996 Revocable Trust
Create a Home Valuation Report for This Property
The Home Valuation Report is an in-depth analysis detailing your home's value as well as a comparison with similar homes in the area
Home Values in the Area
Average Home Value in this Area
Purchase History
| Date | Buyer | Sale Price | Title Company |
|---|---|---|---|
| Wong Wheeler Family Trust | -- | None Listed On Document | |
| Wong Stevan F | -- | Chicago Title Company | |
| Wheeler Joellen | $500,000 | Title Land Company | |
| Norby Kristin C | -- | -- |
Source: Public Records
Mortgage History
| Date | Status | Borrower | Loan Amount |
|---|---|---|---|
| Previous Owner | Wong Stevan F | $415,000 | |
| Previous Owner | Wheeler Joellen | $400,000 |
Source: Public Records
Tax History Compared to Growth
Tax History
| Year | Tax Paid | Tax Assessment Tax Assessment Total Assessment is a certain percentage of the fair market value that is determined by local assessors to be the total taxable value of land and additions on the property. | Land | Improvement |
|---|---|---|---|---|
| 2025 | $9,838 | $814,325 | $488,599 | $325,726 |
| 2024 | $9,838 | $798,359 | $479,019 | $319,340 |
| 2023 | $9,652 | $782,706 | $469,627 | $313,079 |
| 2022 | $9,209 | $767,360 | $460,419 | $306,941 |
| 2021 | $9,089 | $752,315 | $451,392 | $300,923 |
| 2019 | $8,818 | $730,003 | $438,004 | $291,999 |
| 2018 | $8,752 | $715,690 | $429,416 | $286,274 |
| 2016 | $8,364 | $687,901 | $412,743 | $275,158 |
| 2015 | $8,242 | $677,569 | $406,544 | $271,025 |
| 2014 | $8,273 | $664,297 | $398,581 | $265,716 |
Source: Public Records
Map
Nearby Homes
- 11500 Kingsland St
- 3218 S Barrington Ave
- 3230 S Barrington Ave
- 3238 Corinth Ave
- 11523 Vienna Way
- 3491 Butler Ave
- 11931 Lawler St
- 3021 Barry Ave
- 3134 Granville Ave
- 11600 National Blvd
- 11428 National Blvd Unit 101
- 11516 Clarkson Rd
- 11286 Westminster Ave Unit 101
- 11702 Charnock Rd
- 11419 Charnock Rd
- 3601 Mclaughlin Ave
- 3500 Tuller Ave
- 11622 Charnock Rd
- 3300 S Sepulveda Blvd Unit L27
- 11120 Queensland St Unit H57
- 3311 Coolidge Ave
- 3269 Coolidge Ave
- 11540 Coolidge Place
- 3317 Coolidge Ave
- 11556 Coolidge Place
- 3261 Coolidge Ave
- 3306 Coolidge Ave
- 3300 Coolidge Ave
- 3336 Colbert Ave
- 3312 Coolidge Ave
- 3323 Coolidge Ave
- 3342 Colbert Ave
- 3266 Coolidge Ave
- 3330 Colbert Ave
- 3318 Coolidge Ave
- 11555 Coolidge Place
- 3260 Coolidge Ave
- 3348 Colbert Ave
- 3322 Colbert Ave
- 11547 Coolidge Place