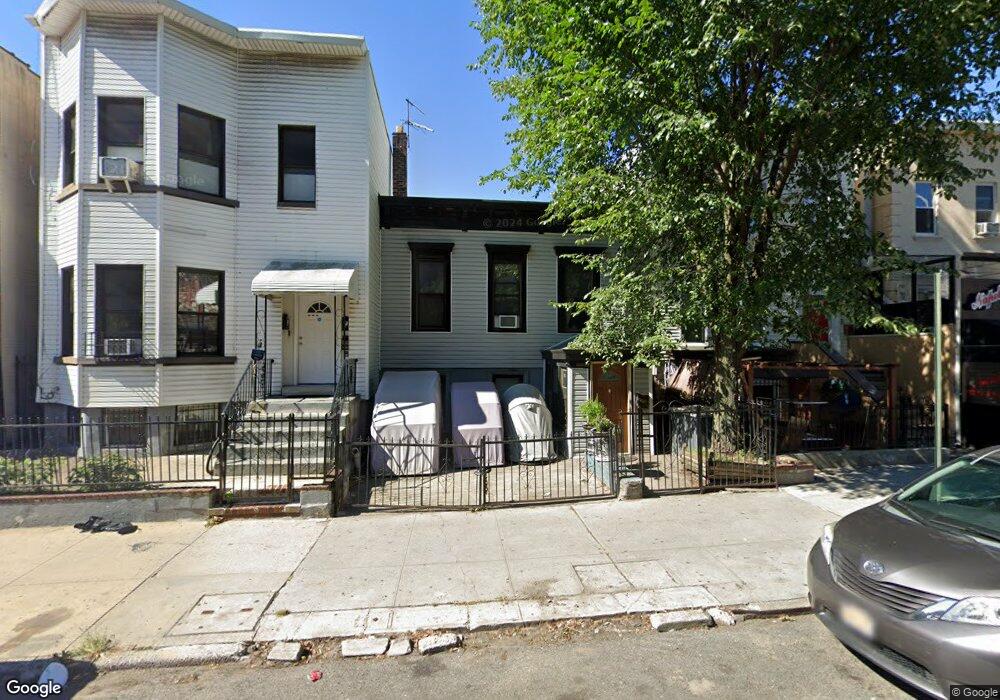
3306 35th Ave Astoria, NY 11106
Astoria NeighborhoodEstimated Value: $1,203,000 - $1,451,000
5
Beds
3
Baths
1,608
Sq Ft
$828/Sq Ft
Est. Value
About This Home
This home is located at 3306 35th Ave, Astoria, NY 11106 and is currently estimated at $1,331,384, approximately $827 per square foot. 3306 35th Ave is a home located in Queens County with nearby schools including P.S. 166Q The Henry Gradstein School, I.S. 204 Oliver W. Holmes, and Long Island City High School.
Ownership History
Date
Name
Owned For
Owner Type
Purchase Details
Closed on
Mar 2, 2022
Sold by
Wasey Aam A and Wazed Asm S
Bought by
Wasey Aam A
Current Estimated Value
Home Financials for this Owner
Home Financials are based on the most recent Mortgage that was taken out on this home.
Original Mortgage
$900,000
Outstanding Balance
$840,605
Interest Rate
3.89%
Mortgage Type
Purchase Money Mortgage
Estimated Equity
$490,779
Purchase Details
Closed on
Oct 29, 2013
Sold by
33-06 Realty Llc
Bought by
Wasey Aam A and Wazed Asm A
Home Financials for this Owner
Home Financials are based on the most recent Mortgage that was taken out on this home.
Original Mortgage
$644,972
Interest Rate
4.52%
Mortgage Type
Purchase Money Mortgage
Purchase Details
Closed on
Jul 8, 1999
Sold by
Vera Cesar and Rodriguez Rose
Bought by
33-06 Realty Llc
Home Financials for this Owner
Home Financials are based on the most recent Mortgage that was taken out on this home.
Original Mortgage
$172,000
Interest Rate
7.54%
Mortgage Type
Purchase Money Mortgage
Create a Home Valuation Report for This Property
The Home Valuation Report is an in-depth analysis detailing your home's value as well as a comparison with similar homes in the area
Home Values in the Area
Average Home Value in this Area
Purchase History
| Date | Buyer | Sale Price | Title Company |
|---|---|---|---|
| Wasey Aam A | -- | -- | |
| Wasey Aam A | $689,000 | -- | |
| 33-06 Realty Llc | $215,000 | First American Title Ins Co |
Source: Public Records
Mortgage History
| Date | Status | Borrower | Loan Amount |
|---|---|---|---|
| Open | Wasey Aam A | $900,000 | |
| Closed | Wasey Aam A | $644,972 | |
| Previous Owner | 33-06 Realty Llc | $172,000 |
Source: Public Records
Tax History Compared to Growth
Tax History
| Year | Tax Paid | Tax Assessment Tax Assessment Total Assessment is a certain percentage of the fair market value that is determined by local assessors to be the total taxable value of land and additions on the property. | Land | Improvement |
|---|---|---|---|---|
| 2025 | $7,254 | $38,263 | $8,159 | $30,104 |
| 2024 | $7,254 | $36,116 | $7,234 | $28,882 |
| 2023 | $7,254 | $36,116 | $7,442 | $28,674 |
| 2022 | $6,866 | $78,900 | $15,480 | $63,420 |
| 2021 | $7,110 | $65,400 | $15,480 | $49,920 |
| 2020 | $6,749 | $67,680 | $15,480 | $52,200 |
| 2019 | $6,296 | $61,320 | $15,480 | $45,840 |
| 2018 | $6,135 | $30,097 | $8,122 | $21,975 |
| 2017 | $5,843 | $28,663 | $8,272 | $20,391 |
| 2016 | $5,628 | $28,663 | $8,272 | $20,391 |
| 2015 | $3,261 | $26,572 | $10,533 | $16,039 |
| 2014 | $3,261 | $25,081 | $10,555 | $14,526 |
Source: Public Records
Map
Nearby Homes
- 34-32 35th St Unit 3-F
- 35-34 31st St
- 36-09 31st St
- 36-11 31st St
- 32-86 33rd St Unit F8
- 35-40 30th St Unit 1G
- 36-44 32nd St
- 35-55 29th St Unit 6J
- 35-55 29th St Unit 3D
- 36-25 30th St Unit 1F
- 3284 36th St
- 3529 28th St
- 35-35 28th St
- 34-12 29th St
- 3361 29th St
- 37-14 34th St Unit N-3E
- 37-14 34th St Unit S4G
- 37-14 34th St Unit N-5E
- 28-07 36th Ave
- 28-02 34th Ave
- 3308 35th Ave
- 33-08 35th Ave
- 3304 35th Ave
- 3507 33rd St
- 3310 35th Ave
- 3509 33rd St
- 3302 35th Ave
- 3511 33rd St
- 33-06 35th Ave
- 3513 33rd St
- 35-13 33 Rd St Unit 2
- 35-13 33rd St
- 35-13 33rd St Unit 2
- 3506 34th St
- 35-17 33 Rd St Unit TH
- 35-17 33 Rd St Unit 1
- 3517 33rd St
- 35-17 33rd St
- 35-17 33rd St Unit 1
- 35-19 33 Rd St Unit 3