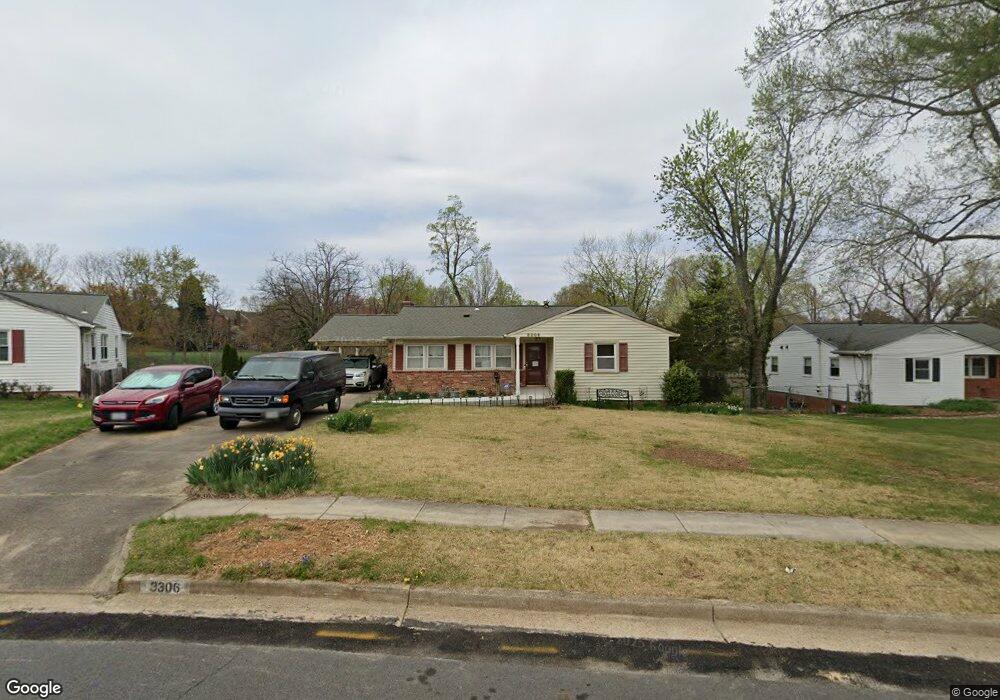
3306 Chicamuxen Ct Falls Church, VA 22041
Estimated Value: $701,000 - $836,000
--
Bed
3
Baths
1,312
Sq Ft
$596/Sq Ft
Est. Value
About This Home
This home is located at 3306 Chicamuxen Ct, Falls Church, VA 22041 and is currently estimated at $782,065, approximately $596 per square foot. 3306 Chicamuxen Ct is a home located in Fairfax County with nearby schools including Glasgow Middle School, Justice High School, and St. Anthony of Padua School.
Ownership History
Date
Name
Owned For
Owner Type
Purchase Details
Closed on
Apr 1, 2020
Sold by
Bowling Samuel Y and Lepelletier Jan Marie
Bought by
Bowling Samuel Young and Lepelletier Jan Marie
Current Estimated Value
Purchase Details
Closed on
Apr 1, 1992
Bought by
Lepelletier Jan M and Bowling Samuel Y
Create a Home Valuation Report for This Property
The Home Valuation Report is an in-depth analysis detailing your home's value as well as a comparison with similar homes in the area
Home Values in the Area
Average Home Value in this Area
Purchase History
| Date | Buyer | Sale Price | Title Company |
|---|---|---|---|
| Bowling Samuel Young | -- | None Available | |
| Lepelletier Jan M | -- | -- |
Source: Public Records
Tax History Compared to Growth
Tax History
| Year | Tax Paid | Tax Assessment Tax Assessment Total Assessment is a certain percentage of the fair market value that is determined by local assessors to be the total taxable value of land and additions on the property. | Land | Improvement |
|---|---|---|---|---|
| 2025 | $9,123 | $796,940 | $392,000 | $404,940 |
| 2024 | $9,123 | $727,660 | $342,000 | $385,660 |
| 2023 | $8,694 | $719,310 | $342,000 | $377,310 |
| 2022 | $7,924 | $644,620 | $307,000 | $337,620 |
| 2021 | $6,571 | $520,510 | $272,000 | $248,510 |
| 2020 | $6,440 | $507,740 | $267,000 | $240,740 |
| 2019 | $6,312 | $495,740 | $255,000 | $240,740 |
| 2018 | $5,392 | $468,860 | $248,000 | $220,860 |
| 2017 | $5,662 | $452,860 | $232,000 | $220,860 |
| 2016 | $5,601 | $447,860 | $227,000 | $220,860 |
| 2015 | $5,151 | $424,930 | $214,000 | $210,930 |
| 2014 | $4,913 | $404,820 | $202,000 | $202,820 |
Source: Public Records
Map
Nearby Homes
- 5936 Munson Ct
- 3391 Lakeside View Dr Unit 20-5
- 3345 Lakeside View Dr Unit 7-7
- 526 S Carlin Springs Rd
- 3100 S Manchester St Unit 442
- 3100 S Manchester St Unit 909
- 3100 S Manchester St Unit 813
- 6057 Brook Dr
- 16 S Manchester St Unit 8
- 6001 Arlington Blvd Unit 118
- 6001 Arlington Blvd Unit 821
- 5931 1st St S
- 6065 Munson Hill Rd
- 3015 Fallswood Glen Ct
- 6025 Arlington Blvd
- 3120 Collie Ln
- 3444 Washington Dr
- 5817 2nd St S
- 5815 2nd St S
- 6137 Leesburg Pike Unit 406
- 3308 Chicamuxen Ct
- 3302 Chicamuxen Ct
- 3307 Chicamuxen Ct
- 3310 Chicamuxen Ct
- 3234 Magnolia Ave
- 3300 Chicamuxen Ct
- 3309 Chicamuxen Ct
- 3300 Magnolia Ave
- 3304 Longbranch Dr
- 3308 Longbranch Dr
- 3235 Magnolia Ave
- 3300 Longbranch Dr
- 3312 Longbranch Dr
- 3230 Magnolia Ave
- 3233 Magnolia Ave
- 3303 Magnolia Ave
- 3231 Magnolia Ave
- 5906 Boston Dr
- 5900 Munson Ct
- 3316 Longbranch Dr