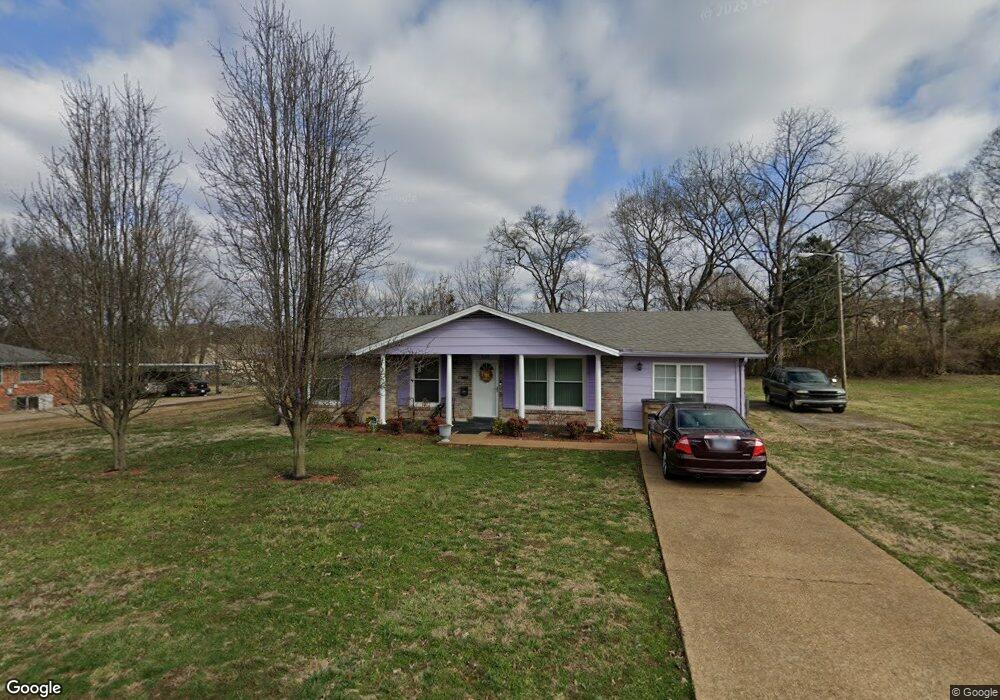
3309 Masonwood Dr Nashville, TN 37207
Bellshire Terrace NeighborhoodEstimated Value: $305,000 - $352,000
3
Beds
1
Bath
1,512
Sq Ft
$216/Sq Ft
Est. Value
About This Home
This home is located at 3309 Masonwood Dr, Nashville, TN 37207 and is currently estimated at $326,913, approximately $216 per square foot. 3309 Masonwood Dr is a home located in Davidson County with nearby schools including Bellshire Elementary Design Center, Madison Middle Prep, and Hunters Lane Comprehensive High School.
Ownership History
Date
Name
Owned For
Owner Type
Purchase Details
Closed on
Apr 10, 2024
Sold by
Gill Sheila R
Bought by
Gill Sheila R and Darden Jamonica
Current Estimated Value
Purchase Details
Closed on
May 23, 2019
Sold by
Gill Sheila R and Wilson Jason L
Bought by
Gill Sheila R
Home Financials for this Owner
Home Financials are based on the most recent Mortgage that was taken out on this home.
Original Mortgage
$85,000
Interest Rate
4.1%
Mortgage Type
New Conventional
Purchase Details
Closed on
Dec 1, 2011
Sold by
Gill Sheila R
Bought by
Robinson Dean
Purchase Details
Closed on
Sep 30, 2011
Sold by
Register Kathy H
Bought by
Gill Sheila R
Home Financials for this Owner
Home Financials are based on the most recent Mortgage that was taken out on this home.
Original Mortgage
$55,000
Interest Rate
4.3%
Mortgage Type
New Conventional
Purchase Details
Closed on
Feb 7, 2003
Sold by
Seward Richard
Bought by
Register Kathy H
Create a Home Valuation Report for This Property
The Home Valuation Report is an in-depth analysis detailing your home's value as well as a comparison with similar homes in the area
Home Values in the Area
Average Home Value in this Area
Purchase History
| Date | Buyer | Sale Price | Title Company |
|---|---|---|---|
| Gill Sheila R | -- | None Listed On Document | |
| Gill Sheila R | -- | Tennessee Nations Ttl Agcy I | |
| Robinson Dean | -- | Horizon Land Title Inc | |
| Gill Sheila R | $99,000 | Horizon Land Title Inc | |
| Register Kathy H | $62,000 | Nations Title Of Tennessee I |
Source: Public Records
Mortgage History
| Date | Status | Borrower | Loan Amount |
|---|---|---|---|
| Previous Owner | Gill Sheila R | $85,000 | |
| Previous Owner | Gill Sheila R | $55,000 |
Source: Public Records
Tax History Compared to Growth
Tax History
| Year | Tax Paid | Tax Assessment Tax Assessment Total Assessment is a certain percentage of the fair market value that is determined by local assessors to be the total taxable value of land and additions on the property. | Land | Improvement |
|---|---|---|---|---|
| 2024 | $1,684 | $51,750 | $10,125 | $41,625 |
| 2023 | $1,684 | $51,750 | $10,125 | $41,625 |
| 2022 | $1,684 | $51,750 | $10,125 | $41,625 |
| 2021 | $1,702 | $51,750 | $10,125 | $41,625 |
| 2020 | $1,187 | $28,125 | $8,250 | $19,875 |
| 2019 | $887 | $28,125 | $8,250 | $19,875 |
| 2018 | $887 | $28,125 | $8,250 | $19,875 |
| 2017 | $887 | $28,125 | $8,250 | $19,875 |
| 2016 | $1,049 | $23,225 | $5,000 | $18,225 |
| 2015 | $1,049 | $23,225 | $5,000 | $18,225 |
| 2014 | $1,049 | $23,225 | $5,000 | $18,225 |
Source: Public Records
Map
Nearby Homes
- 3313 Leondale Terrace
- 3253 Rainwood Dr
- 116 Tiger Cir
- 3247 Masonwood Dr
- 3240 Doverside Dr
- 3172 Lauren Evelyn Way
- 3136 Lauren Evelyn Way
- 3225 Sennadale Ln
- 3116 Lauren Evelyn Way
- 3229 Moorewood Dr
- 3214 Doverside Dr
- 3320 Chesapeake Cir
- 3205 Leswood Ln
- 413 Vailview Dr
- 4348 Skyridge Dr
- 4325 Skyridge Dr
- 3107 Meadowside Ln
- 3061 Richmond Hill Dr
- 4137 Walnut Ridge Dr
- 4125 Walnut Ridge Dr
- 3307 Masonwood Dr
- 3306 Masonwood Dr
- 3311 Masonwood Dr
- 3308 Masonwood Dr
- 3273 Rainwood Dr
- 3277 Rainwood Dr
- 3305 Masonwood Dr
- 3304 Masonwood Dr
- 3310 Masonwood Dr
- 3269 Rainwood Dr
- 3281 Rainwood Dr
- 3265 Rainwood Dr
- 3285 Rainwood Dr
- 3302 Masonwood Dr
- 3313 Masonwood Dr
- 3303 Masonwood Dr
- 3312 Masonwood Dr
- 3261 Rainwood Dr
- 3289 Rainwood Dr
- 3305 Leondale Terrace