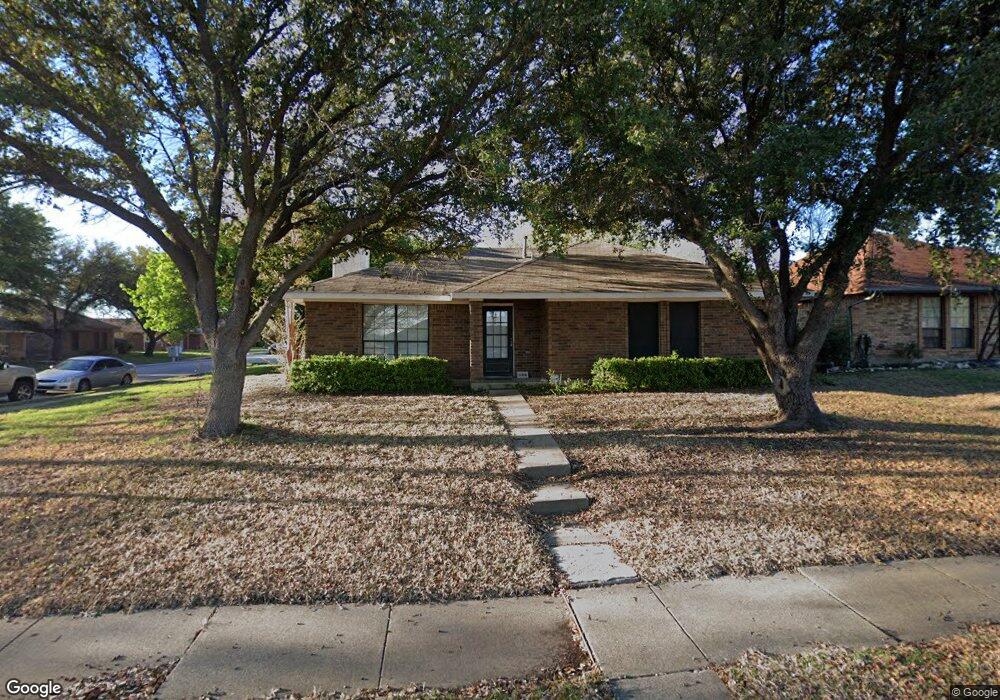
3318 Kellie St Sachse, TX 75048
Estimated Value: $284,299 - $324,000
3
Beds
2
Baths
1,372
Sq Ft
$226/Sq Ft
Est. Value
About This Home
This home is located at 3318 Kellie St, Sachse, TX 75048 and is currently estimated at $309,825, approximately $225 per square foot. 3318 Kellie St is a home located in Dallas County with nearby schools including Firewheel Christian Academy and Pinnacle Montessori of Sachse.
Ownership History
Date
Name
Owned For
Owner Type
Purchase Details
Closed on
Apr 12, 2006
Sold by
Pitts Bethany
Bought by
Mccord Bradley
Current Estimated Value
Home Financials for this Owner
Home Financials are based on the most recent Mortgage that was taken out on this home.
Original Mortgage
$90,000
Outstanding Balance
$51,600
Interest Rate
6.32%
Mortgage Type
Fannie Mae Freddie Mac
Estimated Equity
$258,225
Purchase Details
Closed on
Aug 20, 1999
Sold by
Mcpherson Denise Lee Joeris and Macpherson Steven Brian
Bought by
Pitts Bethany
Home Financials for this Owner
Home Financials are based on the most recent Mortgage that was taken out on this home.
Original Mortgage
$83,947
Interest Rate
7.65%
Mortgage Type
FHA
Purchase Details
Closed on
Jan 16, 1997
Sold by
Joeris Keith Edward
Bought by
Joeris Denise Lee
Purchase Details
Closed on
Nov 7, 1996
Sold by
Joeris Keith Edward
Bought by
Joeris Denise Lee
Create a Home Valuation Report for This Property
The Home Valuation Report is an in-depth analysis detailing your home's value as well as a comparison with similar homes in the area
Home Values in the Area
Average Home Value in this Area
Purchase History
| Date | Buyer | Sale Price | Title Company |
|---|---|---|---|
| Mccord Bradley | -- | None Available | |
| Pitts Bethany | -- | -- | |
| Joeris Denise Lee | -- | -- | |
| Joeris Denise Lee | -- | -- |
Source: Public Records
Mortgage History
| Date | Status | Borrower | Loan Amount |
|---|---|---|---|
| Open | Mccord Bradley | $90,000 | |
| Previous Owner | Pitts Bethany | $83,947 | |
| Closed | Pitts Bethany | $5,000 |
Source: Public Records
Tax History Compared to Growth
Tax History
| Year | Tax Paid | Tax Assessment Tax Assessment Total Assessment is a certain percentage of the fair market value that is determined by local assessors to be the total taxable value of land and additions on the property. | Land | Improvement |
|---|---|---|---|---|
| 2025 | $3,958 | $249,370 | $65,000 | $184,370 |
| 2024 | $3,958 | $276,670 | $65,000 | $211,670 |
| 2023 | $3,958 | $276,670 | $65,000 | $211,670 |
| 2022 | $5,212 | $217,840 | $65,000 | $152,840 |
| 2021 | $4,551 | $176,850 | $40,000 | $136,850 |
| 2020 | $4,627 | $176,850 | $40,000 | $136,850 |
| 2019 | $5,016 | $176,850 | $40,000 | $136,850 |
| 2018 | $4,352 | $151,970 | $40,000 | $111,970 |
| 2017 | $3,601 | $125,380 | $30,000 | $95,380 |
| 2016 | $3,212 | $111,830 | $20,000 | $91,830 |
| 2015 | $2,280 | $111,830 | $20,000 | $91,830 |
| 2014 | $2,280 | $84,820 | $20,000 | $64,820 |
Source: Public Records
Map
Nearby Homes