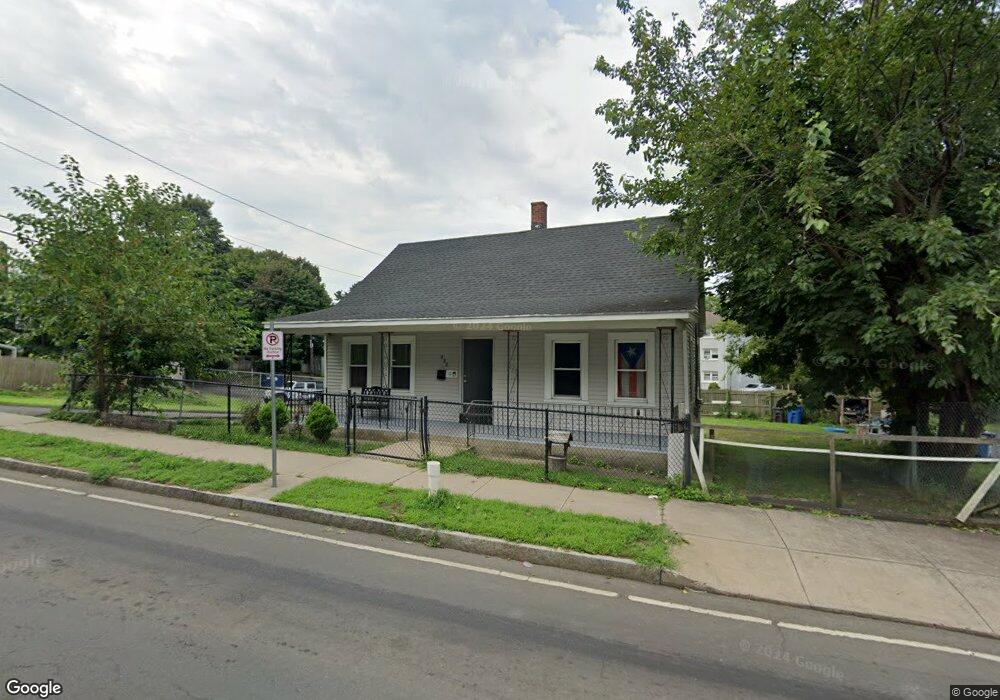
332 Quinnipiac Ave New Haven, CT 06513
Fair Haven Heights NeighborhoodEstimated Value: $227,000 - $402,000
4
Beds
1
Bath
1,610
Sq Ft
$194/Sq Ft
Est. Value
About This Home
This home is located at 332 Quinnipiac Ave, New Haven, CT 06513 and is currently estimated at $311,700, approximately $193 per square foot. 332 Quinnipiac Ave is a home located in New Haven County with nearby schools including Ross Woodward, Cold Spring School, and St Francis & St Rose Of Lima School.
Ownership History
Date
Name
Owned For
Owner Type
Purchase Details
Closed on
Mar 24, 2021
Sold by
Re Fund 2 Sfr 1 Llc
Bought by
Ref 2 Sfr 1 De Llc
Current Estimated Value
Home Financials for this Owner
Home Financials are based on the most recent Mortgage that was taken out on this home.
Original Mortgage
$25,600,000
Outstanding Balance
$2,730,032
Interest Rate
2.9%
Mortgage Type
Stand Alone Refi Refinance Of Original Loan
Estimated Equity
-$2,418,332
Purchase Details
Closed on
Nov 16, 2020
Sold by
Burr Well St Llc
Bought by
Re Fund 2 Nh Llc
Purchase Details
Closed on
Oct 14, 2020
Sold by
Re Fund 2 Nh Llc
Bought by
Re Fund 2 Sfr 1 Llc
Purchase Details
Closed on
Sep 14, 2017
Sold by
32332 Quinnipiac Ave L
Bought by
Bur Well St Llc
Purchase Details
Closed on
Feb 17, 2004
Sold by
Rodriquez Clotilde
Bought by
New Oasis Llc
Create a Home Valuation Report for This Property
The Home Valuation Report is an in-depth analysis detailing your home's value as well as a comparison with similar homes in the area
Home Values in the Area
Average Home Value in this Area
Purchase History
| Date | Buyer | Sale Price | Title Company |
|---|---|---|---|
| Ref 2 Sfr 1 De Llc | -- | None Available | |
| Re Fund 2 Nh Llc | $858,672 | None Available | |
| Re Fund 2 Sfr 1 Llc | -- | None Available | |
| Bur Well St Llc | -- | -- | |
| New Oasis Llc | $115,000 | -- |
Source: Public Records
Mortgage History
| Date | Status | Borrower | Loan Amount |
|---|---|---|---|
| Open | Ref 2 Sfr 1 De Llc | $25,600,000 |
Source: Public Records
Tax History Compared to Growth
Tax History
| Year | Tax Paid | Tax Assessment Tax Assessment Total Assessment is a certain percentage of the fair market value that is determined by local assessors to be the total taxable value of land and additions on the property. | Land | Improvement |
|---|---|---|---|---|
| 2025 | $5,535 | $140,490 | $40,250 | $100,240 |
| 2024 | $5,409 | $140,490 | $40,250 | $100,240 |
| 2023 | $5,226 | $140,490 | $40,250 | $100,240 |
| 2022 | $5,584 | $140,490 | $40,250 | $100,240 |
| 2021 | $4,583 | $104,440 | $26,390 | $78,050 |
| 2020 | $4,583 | $104,440 | $26,390 | $78,050 |
| 2019 | $4,489 | $104,440 | $26,390 | $78,050 |
| 2018 | $4,489 | $104,440 | $26,390 | $78,050 |
| 2017 | $4,040 | $104,440 | $26,390 | $78,050 |
| 2016 | $4,165 | $100,240 | $24,920 | $75,320 |
| 2015 | $4,165 | $100,240 | $24,920 | $75,320 |
| 2014 | $4,165 | $100,240 | $24,920 | $75,320 |
Source: Public Records
Map
Nearby Homes
- 12 E Ferry St
- 193 Farren Ave
- 196 Farren Ave
- 190 Farren Ave
- 95 Lenox St Unit L
- 121 Lexington Ave Unit 21
- 172 Quinnipiac Ave
- 1 Front St Unit 1 Kel
- 28 Farren Ave
- 33 Chapel St
- 533 Quinnipiac Ave
- 8 Front St Unit D
- 32 E Pearl St
- 43 E Pearl St
- 191 Ferry St
- 74 Milton St
- 265 Lexington Ave
- 111 Chapel St
- 76 Front St Unit 76
- 71 Houston St
- 4 E Ferry St
- 318 Quinnipiac Ave
- 320 Quinnipiac Ave Unit 7F
- 320 Quinnipiac Ave Unit 7E
- 320 Quinnipiac Ave Unit 7D
- 320 Quinnipiac Ave Unit 7C
- 320 Quinnipiac Ave Unit 7B
- 320 Quinnipiac Ave Unit 7A
- 320 Quinnipiac Ave Unit 6F
- 320 Quinnipiac Ave Unit 6E
- 320 Quinnipiac Ave Unit 6D
- 320 Quinnipiac Ave Unit 6C
- 320 Quinnipiac Ave Unit 6B
- 320 Quinnipiac Ave Unit 6A
- 320 Quinnipiac Ave Unit 5F
- 320 Quinnipiac Ave Unit 5E
- 320 Quinnipiac Ave Unit 5D
- 320 Quinnipiac Ave Unit 5C
- 320 Quinnipiac Ave Unit 5B
- 320 Quinnipiac Ave Unit 5A