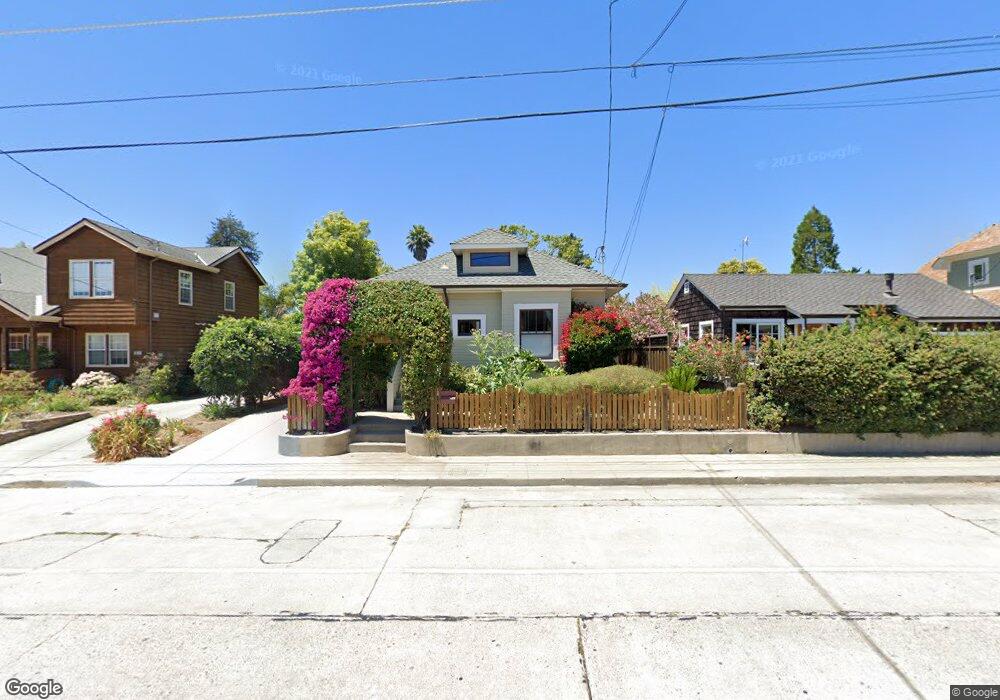
333 Stanford Ave Santa Cruz, CA 95062
Banana Belt NeighborhoodEstimated Value: $1,243,000 - $1,473,000
3
Beds
2
Baths
1,025
Sq Ft
$1,291/Sq Ft
Est. Value
About This Home
This home is located at 333 Stanford Ave, Santa Cruz, CA 95062 and is currently estimated at $1,323,205, approximately $1,290 per square foot. 333 Stanford Ave is a home located in Santa Cruz County with nearby schools including De Laveaga Elementary School, Mission Hill Middle School, and Harbor High School.
Ownership History
Date
Name
Owned For
Owner Type
Purchase Details
Closed on
May 23, 2025
Sold by
Carpenter Scott D
Bought by
Scott Carpenter Revocable Trust and Carpenter
Current Estimated Value
Purchase Details
Closed on
Feb 24, 2003
Sold by
Ambrose Lael
Bought by
Carpenter Scott D
Home Financials for this Owner
Home Financials are based on the most recent Mortgage that was taken out on this home.
Original Mortgage
$480,250
Interest Rate
6.45%
Purchase Details
Closed on
Jul 11, 2001
Sold by
Lesh Michael G
Bought by
Ambrose Lael
Purchase Details
Closed on
Feb 19, 1999
Sold by
Edwards Bruce T and Coulon Annette R
Bought by
Ambrose Lael and Lesh Michael
Home Financials for this Owner
Home Financials are based on the most recent Mortgage that was taken out on this home.
Original Mortgage
$240,000
Interest Rate
6.78%
Create a Home Valuation Report for This Property
The Home Valuation Report is an in-depth analysis detailing your home's value as well as a comparison with similar homes in the area
Home Values in the Area
Average Home Value in this Area
Purchase History
| Date | Buyer | Sale Price | Title Company |
|---|---|---|---|
| Scott Carpenter Revocable Trust | -- | None Listed On Document | |
| Carpenter Scott D | $565,000 | Santa Cruz Title Company | |
| Ambrose Lael | -- | -- | |
| Ambrose Lael | $336,000 | Old Republic Title Company |
Source: Public Records
Mortgage History
| Date | Status | Borrower | Loan Amount |
|---|---|---|---|
| Previous Owner | Carpenter Scott D | $480,250 | |
| Previous Owner | Ambrose Lael | $240,000 | |
| Closed | Carpenter Scott D | $84,750 |
Source: Public Records
Tax History Compared to Growth
Tax History
| Year | Tax Paid | Tax Assessment Tax Assessment Total Assessment is a certain percentage of the fair market value that is determined by local assessors to be the total taxable value of land and additions on the property. | Land | Improvement |
|---|---|---|---|---|
| 2025 | $9,165 | $818,313 | $490,989 | $327,324 |
| 2023 | $9,055 | $786,536 | $471,923 | $314,613 |
| 2022 | $8,954 | $771,114 | $462,670 | $308,444 |
| 2021 | $8,768 | $755,994 | $453,598 | $302,396 |
| 2020 | $8,700 | $748,243 | $448,947 | $299,296 |
| 2019 | $8,509 | $733,571 | $440,144 | $293,427 |
| 2018 | $8,413 | $719,188 | $431,514 | $287,674 |
| 2017 | $8,306 | $705,085 | $423,052 | $282,033 |
| 2016 | $7,848 | $691,260 | $414,757 | $276,503 |
| 2015 | $7,659 | $680,877 | $408,527 | $272,350 |
| 2014 | $7,523 | $666,867 | $400,120 | $266,747 |
Source: Public Records
Map
Nearby Homes
- 0 Market St
- 118 Stoney Creek Rd
- 305 Morrissey Blvd
- 209 Fieldcrest Ln
- 104 Meadowview Ln
- 719 Darwin St
- 229 Coulson Ave
- 111 Elk St
- 511 Pacheco Ave
- 180 Delaveaga Park Dr
- 916 Melrose Ave
- 1221 Broadway Unit 2
- 33 Edgewood Way
- 180 Dakota Ave Unit D
- 1122 Seabright Ave
- 1720 Ocean St
- 205 Roosevelt Terrace
- 631 Park Way
- 130 Darwin St
- 304 Harbor Dr
- 337 Stanford Ave
- 329 Stanford Ave
- 339 Stanford Ave
- 323 Stanford Ave
- 1046 N Branciforte Ave
- 345 Stanford Ave
- 1040 N Branciforte Ave
- 1050 N Branciforte Ave
- 319 Stanford Ave
- 1034 N Branciforte Ave
- 347 Stanford Ave
- 1054 N Branciforte Ave
- 117 Stanford Ave
- 336 Stanford Ave
- 338 Stanford Ave
- 334 Stanford Ave
- 340 Stanford Ave
- 1030 N Branciforte Ave
- 1058 N Branciforte Ave
- 315 Stanford Ave